
This article is my experience with memory balloon on virtual machine.
I came across an ElasticSearch server (ESXi guest with 32GB physical memory) where the main process keeps dying of OOM. Even worse, after the OOM event, the free memory left is about 10G and Elastic Search cannot start because its JVM is set with -Xms16g in /etc/elasticsearch/jvm.options. So I need to address the OutOfMemory error.
To understand what triggered OOM, we can use dmesg or just check /var/log/message, where the memory snapshot by OOM killer is displayed during the kernel panic:
Apr 26 04:18:15 elastichost kernel: kworker/7:1 invoked oom-killer: gfp_mask=0x200d2, order=0, oom_score_adj=0
Apr 26 04:18:15 elastichost kernel: kworker/7:1 cpuset=/ mems_allowed=0
Apr 26 04:18:15 elastichost kernel: CPU: 7 PID: 13968 Comm: kworker/7:1 Kdump: loaded Not tainted 3.10.0-957.1.3.el7.x86_64 #1
Apr 26 04:18:15 elastichost kernel: Hardware name: VMware, Inc. VMware Virtual Platform/440BX Desktop Reference Platform, BIOS 6.00 12/12/2018
Apr 26 04:18:15 elastichost kernel: Workqueue: events_freezable vmballoon_work [vmw_balloon]
Apr 26 04:18:15 elastichost kernel: Call Trace:
Apr 26 04:18:15 elastichost kernel: [<ffffffffa2961e41>] dump_stack+0x19/0x1b
Apr 26 04:18:15 elastichost kernel: [<ffffffffa295c86a>] dump_header+0x90/0x229
Apr 26 04:18:15 elastichost kernel: [<ffffffffa2301052>] ? ktime_get_ts64+0x52/0xf0
Apr 26 04:18:15 elastichost kernel: [<ffffffffa23581ef>] ? delayacct_end+0x8f/0xb0
Apr 26 04:18:15 elastichost kernel: [<ffffffffa23ba4e4>] oom_kill_process+0x254/0x3d0
Apr 26 04:18:15 elastichost kernel: [<ffffffffa23b9f8d>] ? oom_unkillable_task+0xcd/0x120
Apr 26 04:18:15 elastichost kernel: [<ffffffffa23ba036>] ? find_lock_task_mm+0x56/0xc0
Apr 26 04:18:15 elastichost kernel: [<ffffffffa23bad26>] out_of_memory+0x4b6/0x4f0
Apr 26 04:18:15 elastichost kernel: [<ffffffffa295d36e>] __alloc_pages_slowpath+0x5d6/0x724
Apr 26 04:18:15 elastichost kernel: [<ffffffffa23c1105>] __alloc_pages_nodemask+0x405/0x420
Apr 26 04:18:15 elastichost kernel: [<ffffffffa240df68>] alloc_pages_current+0x98/0x110
Apr 26 04:18:15 elastichost kernel: [<ffffffffc05f1f84>] vmballoon_work+0x454/0x6ff [vmw_balloon]
Apr 26 04:18:15 elastichost kernel: [<ffffffffa22b9d4f>] process_one_work+0x17f/0x440
Apr 26 04:18:15 elastichost kernel: [<ffffffffa22bade6>] worker_thread+0x126/0x3c0
Apr 26 04:18:15 elastichost kernel: [<ffffffffa22bacc0>] ? manage_workers.isra.25+0x2a0/0x2a0
Apr 26 04:18:15 elastichost kernel: [<ffffffffa22c1c31>] kthread+0xd1/0xe0
Apr 26 04:18:15 elastichost kernel: [<ffffffffa22c1b60>] ? insert_kthread_work+0x40/0x40
Apr 26 04:18:15 elastichost kernel: [<ffffffffa2974c37>] ret_from_fork_nospec_begin+0x21/0x21
Apr 26 04:18:15 elastichost kernel: [<ffffffffa22c1b60>] ? insert_kthread_work+0x40/0x40
Apr 26 04:18:15 elastichost kernel: Mem-Info:
Apr 26 04:18:15 elastichost kernel: active_anon:3649243 inactive_anon:439380 isolated_anon:0#012 active_file:480 inactive_file:693 isolated_file:0#012 unevictable:0 dirty:2 writeback:0 unstable:0#012 slab_reclaimable:77845 slab_unreclaimable:10219#012 mapped:10086 shmem:9596 pagetables:16727 bounce:0#012 free:50116 free_pcp:238 free_cma:0
Apr 26 04:18:15 elastichost kernel: Node 0 DMA free:15892kB min:32kB low:40kB high:48kB active_anon:0kB inactive_anon:0kB active_file:0kB inactive_file:0kB unevictable:0kB isolated(anon):0kB isolated(file):0kB present:15992kB managed:15908kB mlocked:0kB dirty:0kB writeback:0kB mapped:0kB shmem:0kB slab_reclaimable:0kB slab_unreclaimable:16kB kernel_stack:0kB pagetables:0kB unstable:0kB bounce:0kB free_pcp:0kB local_pcp:0kB free_cma:0kB writeback_tmp:0kB pages_scanned:0 all_unreclaimable? yes
Apr 26 04:18:15 elastichost kernel: lowmem_reserve[]: 0 2829 31993 31993
Apr 26 04:18:15 elastichost kernel: Node 0 DMA32 free:122768kB min:5972kB low:7464kB high:8956kB active_anon:471052kB inactive_anon:471040kB active_file:232kB inactive_file:460kB unevictable:0kB isolated(anon):0kB isolated(file):0kB present:3129216kB managed:2897760kB mlocked:0kB dirty:0kB writeback:0kB mapped:584kB shmem:300kB slab_reclaimable:23908kB slab_unreclaimable:3872kB kernel_stack:656kB pagetables:6440kB unstable:0kB bounce:0kB free_pcp:288kB local_pcp:0kB free_cma:0kB writeback_tmp:0kB pages_scanned:214 all_unreclaimable? no
Apr 26 04:18:15 elastichost kernel: lowmem_reserve[]: 0 0 29163 29163
Apr 26 04:18:15 elastichost kernel: Node 0 Normal free:61804kB min:61576kB low:76968kB high:92364kB active_anon:14125920kB inactive_anon:1286480kB active_file:1688kB inactive_file:2312kB unevictable:0kB isolated(anon):0kB isolated(file):0kB present:30408704kB managed:29866500kB mlocked:0kB dirty:8kB writeback:0kB mapped:39760kB shmem:38084kB slab_reclaimable:287472kB slab_unreclaimable:36988kB kernel_stack:5680kB pagetables:60468kB unstable:0kB bounce:0kB free_pcp:804kB local_pcp:0kB free_cma:0kB writeback_tmp:0kB pages_scanned:698 all_unreclaimable? no
Apr 26 04:18:15 elastichost kernel: lowmem_reserve[]: 0 0 0 0
Apr 26 04:18:15 elastichost kernel: Node 0 DMA: 1*4kB (U) 0*8kB 1*16kB (U) 0*32kB 2*64kB (U) 1*128kB (U) 1*256kB (U) 0*512kB 1*1024kB (U) 1*2048kB (M) 3*4096kB (M) = 15892kB
Apr 26 04:18:15 elastichost kernel: Node 0 DMA32: 407*4kB (UEM) 506*8kB (UEM) 431*16kB (UM) 364*32kB (M) 272*64kB (UM) 179*128kB (UM) 99*256kB (UM) 35*512kB (M) 11*1024kB (M) 2*2048kB (M) 0*4096kB = 123164kB
Apr 26 04:18:15 elastichost kernel: Node 0 Normal: 15576*4kB (UM) 39*8kB (UM) 0*16kB 0*32kB 0*64kB 0*128kB 0*256kB 0*512kB 0*1024kB 0*2048kB 0*4096kB = 62616kB
Apr 26 04:18:15 elastichost kernel: Node 0 hugepages_total=0 hugepages_free=0 hugepages_surp=0 hugepages_size=1048576kB
Apr 26 04:18:15 elastichost kernel: Node 0 hugepages_total=0 hugepages_free=0 hugepages_surp=0 hugepages_size=2048kB
Apr 26 04:18:15 elastichost kernel: 44652 total pagecache pages
Apr 26 04:18:15 elastichost kernel: 34162 pages in swap cache
Apr 26 04:18:15 elastichost kernel: Swap cache stats: add 10884045, delete 10845872, find 3294122/3678936
Apr 26 04:18:15 elastichost kernel: Free swap  = 0kB
Apr 26 04:18:15 elastichost kernel: Total swap = 2097148kB
Apr 26 04:18:15 elastichost kernel: 8388478 pages RAM
Apr 26 04:18:15 elastichost kernel: 0 pages HighMem/MovableOnly
Apr 26 04:18:15 elastichost kernel: 193436 pages reserved
Apr 26 04:18:15 elastichost kernel: [ pid ]   uid  tgid total_vm      rss nr_ptes swapents oom_score_adj name
Apr 26 04:18:15 elastichost kernel: [ 3164]     0  3164    47420    12996     100     6314             0 systemd-journal
Apr 26 04:18:15 elastichost kernel: [ 3192]     0  3192    11158        2      24      174         -1000 systemd-udevd
Apr 26 04:18:15 elastichost kernel: [ 3198]     0  3198    66023        0      31      117             0 lvmetad
Apr 26 04:18:15 elastichost kernel: [ 6051]     0  6051    15511       20      29      138         -1000 auditd
Apr 26 04:18:15 elastichost kernel: [ 6073]    81  6073    14557       83      32       88          -900 dbus-daemon
Apr 26 04:18:15 elastichost kernel: [ 6075]    32  6075    18412       16      39      166             0 rpcbind
Apr 26 04:18:15 elastichost kernel: [ 6076]     0  6076    50404        0      37      171             0 gssproxy
Apr 26 04:18:15 elastichost kernel: [ 6077]     0  6077     5422       50      15       41             0 irqbalance
Apr 26 04:18:15 elastichost kernel: [ 6078]     0  6078   118943      155      85      362             0 NetworkManager
Apr 26 04:18:15 elastichost kernel: [ 6086]     0  6086     6594       47      18       41             0 systemd-logind
Apr 26 04:18:15 elastichost kernel: [ 6087]     0  6087    24892        0      42      402             0 VGAuthService
Apr 26 04:18:15 elastichost kernel: [ 6088]     0  6088    56746      113      58      246             0 vmtoolsd
Apr 26 04:18:15 elastichost kernel: [ 6089]   999  6089   153086      130      61     1787             0 polkitd
Apr 26 04:18:15 elastichost kernel: [ 6129]    38  6129    11817       39      27      140             0 ntpd
Apr 26 04:18:15 elastichost kernel: [ 6464]     0  6464    56962      132      62      970             0 snmpd
Apr 26 04:18:15 elastichost kernel: [ 6468]     0  6468    97733     4770     100      482             0 rsyslogd
Apr 26 04:18:15 elastichost kernel: [ 6470]     0  6470   470477     6332     100      781             0 sh-metricbeat
Apr 26 04:18:15 elastichost kernel: [ 6472]     0  6472   250084     2279      72     2367             0 sh-filebeat
Apr 26 04:18:15 elastichost kernel: [ 6483]     0  6483    28189       26      57      231         -1000 sshd
Apr 26 04:18:15 elastichost kernel: [ 6485]     0  6485   143455      107      97     2667             0 tuned
Apr 26 04:18:15 elastichost kernel: [ 6569]     0  6569    76290      625      41      188             0 avagent.bin
Apr 26 04:18:15 elastichost kernel: [ 6574]    29  6574    12239        1      27      254             0 rpc.statd
Apr 26 04:18:15 elastichost kernel: [ 6601]     0  6601    31572       30      18      129             0 crond
Apr 26 04:18:15 elastichost kernel: [ 6609]     0  6609    27523        1      10       32             0 agetty
Apr 26 04:18:15 elastichost kernel: [ 7451]   494  7451   315970    36412     364     8550             0 node
Apr 26 04:18:15 elastichost kernel: [11272]     0 11272    39154        0      80      336             0 sshd
Apr 26 04:18:15 elastichost kernel: [11277]     0 11277    28885        2      12      112             0 bash
Apr 26 04:18:15 elastichost kernel: [16070]   495 16070 47122631  3994129   15027   457539             0 java
Apr 26 04:18:15 elastichost kernel: [16264]   495 16264    18032        0      31      162             0 controller
Apr 26 04:18:15 elastichost kernel: Out of memory: Kill process 16070 (java) score 512 or sacrifice child
Apr 26 04:18:15 elastichost kernel: Killed process 16264 (controller) total-vm:72128kB, anon-rss:0kB, file-rss:0kB, shmem-rss:0kB
Apr 26 04:18:15 elastichost kernel: java invoked oom-killer: gfp_mask=0x201da, order=0, oom_score_adj=0
Apr 26 04:18:15 elastichost kernel: java cpuset=/ mems_allowed=0
Apr 26 04:18:15 elastichost kernel: CPU: 2 PID: 16265 Comm: java Kdump: loaded Not tainted 3.10.0-957.1.3.el7.x86_64 #1
Apr 26 04:18:15 elastichost kernel: Hardware name: VMware, Inc. VMware Virtual Platform/440BX Desktop Reference Platform, BIOS 6.00 12/12/2018
Apr 26 04:18:15 elastichost kernel: Call Trace:
Apr 26 04:18:15 elastichost kernel: [<ffffffffa2961e41>] dump_stack+0x19/0x1b
Apr 26 04:18:15 elastichost kernel: [<ffffffffa295c86a>] dump_header+0x90/0x229
Apr 26 04:18:15 elastichost kernel: [<ffffffffa2301052>] ? ktime_get_ts64+0x52/0xf0
Apr 26 04:18:15 elastichost kernel: [<ffffffffa23581ef>] ? delayacct_end+0x8f/0xb0
Apr 26 04:18:15 elastichost kernel: [<ffffffffa23ba4e4>] oom_kill_process+0x254/0x3d0
Apr 26 04:18:15 elastichost kernel: [<ffffffffa23b9f8d>] ? oom_unkillable_task+0xcd/0x120
Apr 26 04:18:15 elastichost kernel: [<ffffffffa23ba036>] ? find_lock_task_mm+0x56/0xc0
Apr 26 04:18:15 elastichost kernel: [<ffffffffa23bad26>] out_of_memory+0x4b6/0x4f0
Apr 26 04:18:15 elastichost kernel: [<ffffffffa295d36e>] __alloc_pages_slowpath+0x5d6/0x724
Apr 26 04:18:15 elastichost kernel: [<ffffffffa23c1105>] __alloc_pages_nodemask+0x405/0x420
Apr 26 04:18:15 elastichost kernel: [<ffffffffa240df68>] alloc_pages_current+0x98/0x110
Apr 26 04:18:15 elastichost kernel: [<ffffffffa23b6347>] __page_cache_alloc+0x97/0xb0
Apr 26 04:18:15 elastichost kernel: [<ffffffffa23b8fa8>] filemap_fault+0x298/0x490
Apr 26 04:18:15 elastichost kernel: [<ffffffffc0484d0e>] __xfs_filemap_fault+0x7e/0x1d0 [xfs]
Apr 26 04:18:15 elastichost kernel: [<ffffffffa22c2dc0>] ? wake_bit_function+0x40/0x40
Apr 26 04:18:15 elastichost kernel: [<ffffffffc0484f0c>] xfs_filemap_fault+0x2c/0x30 [xfs]
Apr 26 04:18:15 elastichost kernel: [<ffffffffa23e444a>] __do_fault.isra.59+0x8a/0x100
Apr 26 04:18:15 elastichost kernel: [<ffffffffa23e49fc>] do_read_fault.isra.61+0x4c/0x1b0
Apr 26 04:18:15 elastichost kernel: [<ffffffffa23e93a4>] handle_pte_fault+0x2f4/0xd10
Apr 26 04:18:15 elastichost kernel: [<ffffffffa23ebedd>] handle_mm_fault+0x39d/0x9b0
Apr 26 04:18:15 elastichost kernel: [<ffffffffa296f5e3>] __do_page_fault+0x203/0x500
Apr 26 04:18:15 elastichost kernel: [<ffffffffa296f915>] do_page_fault+0x35/0x90
Apr 26 04:18:15 elastichost kernel: [<ffffffffa296b758>] page_fault+0x28/0x30
Apr 26 04:18:15 elastichost kernel: Mem-Info:
Apr 26 04:18:15 elastichost kernel: active_anon:3607073 inactive_anon:480522 isolated_anon:0#012 active_file:8 inactive_file:0 isolated_file:0#012 unevictable:0 dirty:0 writeback:1 unstable:0#012 slab_reclaimable:75170 slab_unreclaimable:10131#012 mapped:2070 shmem:9592 pagetables:16696 bounce:0#012 free:50006 free_pcp:72 free_cma:0
Apr 26 04:18:15 elastichost kernel: Node 0 DMA free:15892kB min:32kB low:40kB high:48kB active_anon:0kB inactive_anon:0kB active_file:0kB inactive_file:0kB unevictable:0kB isolated(anon):0kB isolated(file):0kB present:15992kB managed:15908kB mlocked:0kB dirty:0kB writeback:0kB mapped:0kB shmem:0kB slab_reclaimable:0kB slab_unreclaimable:16kB kernel_stack:0kB pagetables:0kB unstable:0kB bounce:0kB free_pcp:0kB local_pcp:0kB free_cma:0kB writeback_tmp:0kB pages_scanned:0 all_unreclaimable? yes
Apr 26 04:18:15 elastichost kernel: lowmem_reserve[]: 0 2829 31993 31993
Apr 26 04:18:15 elastichost kernel: Node 0 DMA32 free:122560kB min:5972kB low:7464kB high:8956kB active_anon:471000kB inactive_anon:471076kB active_file:0kB inactive_file:0kB unevictable:0kB isolated(anon):0kB isolated(file):0kB present:3129216kB managed:2897760kB mlocked:0kB dirty:0kB writeback:0kB mapped:292kB shmem:288kB slab_reclaimable:22832kB slab_unreclaimable:3752kB kernel_stack:672kB pagetables:6408kB unstable:0kB bounce:0kB free_pcp:272kB local_pcp:0kB free_cma:0kB writeback_tmp:0kB pages_scanned:215 all_unreclaimable? yes
Apr 26 04:18:15 elastichost kernel: lowmem_reserve[]: 0 0 29163 29163
Apr 26 04:18:15 elastichost kernel: Node 0 Normal free:61572kB min:61576kB low:76968kB high:92364kB active_anon:13957292kB inactive_anon:1451012kB active_file:32kB inactive_file:0kB unevictable:0kB isolated(anon):0kB isolated(file):0kB present:30408704kB managed:29866500kB mlocked:0kB dirty:0kB writeback:4kB mapped:7988kB shmem:38080kB slab_reclaimable:277848kB slab_unreclaimable:36756kB kernel_stack:5664kB pagetables:60376kB unstable:0kB bounce:0kB free_pcp:16kB local_pcp:0kB free_cma:0kB writeback_tmp:0kB pages_scanned:500 all_unreclaimable? yes
Apr 26 04:18:15 elastichost kernel: lowmem_reserve[]: 0 0 0 0
Apr 26 04:18:15 elastichost kernel: Node 0 DMA: 1*4kB (U) 0*8kB 1*16kB (U) 0*32kB 2*64kB (U) 1*128kB (U) 1*256kB (U) 0*512kB 1*1024kB (U) 1*2048kB (M) 3*4096kB (M) = 15892kB
Apr 26 04:18:15 elastichost kernel: Node 0 DMA32: 393*4kB (UEM) 490*8kB (UEM) 453*16kB (EM) 369*32kB (UEM) 269*64kB (M) 180*128kB (M) 98*256kB (M) 35*512kB (M) 12*1024kB (UM) 1*2048kB (M) 0*4096kB = 122148kB
Apr 26 04:18:15 elastichost kernel: Node 0 Normal: 15440*4kB (UM) 1*8kB (U) 0*16kB 0*32kB 0*64kB 0*128kB 0*256kB 0*512kB 0*1024kB 0*2048kB 0*4096kB = 61768kB
Apr 26 04:18:15 elastichost kernel: Node 0 hugepages_total=0 hugepages_free=0 hugepages_surp=0 hugepages_size=1048576kB
Apr 26 04:18:15 elastichost kernel: Node 0 hugepages_total=0 hugepages_free=0 hugepages_surp=0 hugepages_size=2048kB
Apr 26 04:18:15 elastichost kernel: 42975 total pagecache pages
Apr 26 04:18:15 elastichost kernel: 33308 pages in swap cache
Apr 26 04:18:15 elastichost kernel: Swap cache stats: add 10884233, delete 10846914, find 3294127/3678944
Apr 26 04:18:15 elastichost kernel: Free swap  = 0kB
Apr 26 04:18:15 elastichost kernel: Total swap = 2097148kB
Apr 26 04:18:15 elastichost kernel: 8388478 pages RAM
Apr 26 04:18:15 elastichost kernel: 0 pages HighMem/MovableOnly
Apr 26 04:18:15 elastichost kernel: 193436 pages reserved
Apr 26 04:18:15 elastichost kernel: [ pid ]   uid  tgid total_vm      rss nr_ptes swapents oom_score_adj name
Apr 26 04:18:15 elastichost kernel: [ 3164]     0  3164    47420     4016     100     6314             0 systemd-journal
Apr 26 04:18:15 elastichost kernel: [ 3192]     0  3192    11158        2      24      174         -1000 systemd-udevd
Apr 26 04:18:15 elastichost kernel: [ 3198]     0  3198    66023        0      31      117             0 lvmetad
Apr 26 04:18:15 elastichost kernel: [ 6051]     0  6051    15511       20      29      138         -1000 auditd
Apr 26 04:18:15 elastichost kernel: [ 6073]    81  6073    14557       78      32       88          -900 dbus-daemon
Apr 26 04:18:15 elastichost kernel: [ 6075]    32  6075    18412       16      39      166             0 rpcbind
Apr 26 04:18:15 elastichost kernel: [ 6076]     0  6076    50404        0      37      171             0 gssproxy
Apr 26 04:18:15 elastichost kernel: [ 6077]     0  6077     5422       46      15       41             0 irqbalance
Apr 26 04:18:15 elastichost kernel: [ 6078]     0  6078   118943      155      85      362             0 NetworkManager
Apr 26 04:18:15 elastichost kernel: [ 6086]     0  6086     6594       42      18       41             0 systemd-logind
Apr 26 04:18:15 elastichost kernel: [ 6087]     0  6087    24892        0      42      402             0 VGAuthService
Apr 26 04:18:15 elastichost kernel: [ 6088]     0  6088    56746       91      58      246             0 vmtoolsd
Apr 26 04:18:15 elastichost kernel: [ 6089]   999  6089   153086      130      61     1787             0 polkitd
Apr 26 04:18:15 elastichost kernel: [ 6129]    38  6129    11817       36      27      140             0 ntpd
Apr 26 04:18:15 elastichost kernel: [ 6464]     0  6464    56962      130      62      970             0 snmpd
Apr 26 04:18:15 elastichost kernel: [ 6468]     0  6468    97733     1215     100      485             0 rsyslogd
Apr 26 04:18:15 elastichost kernel: [ 6470]     0  6470   470477     6230     100      781             0 sh-metricbeat
Apr 26 04:18:15 elastichost kernel: [ 6472]     0  6472   250084     2279      72     2367             0 sh-filebeat
Apr 26 04:18:15 elastichost kernel: [ 6483]     0  6483    28189       26      57      231         -1000 sshd
Apr 26 04:18:15 elastichost kernel: [ 6485]     0  6485   143455      107      97     2667             0 tuned
Apr 26 04:18:15 elastichost kernel: [ 6569]     0  6569    76290      625      41      188             0 avagent.bin
Apr 26 04:18:15 elastichost kernel: [ 6574]    29  6574    12239        1      27      254             0 rpc.statd
Apr 26 04:18:15 elastichost kernel: [ 6601]     0  6601    31572       27      18      129             0 crond
Apr 26 04:18:15 elastichost kernel: [ 6609]     0  6609    27523        1      10       32             0 agetty
Apr 26 04:18:15 elastichost kernel: [ 7451]   494  7451   315970    36412     364     8550             0 node
Apr 26 04:18:15 elastichost kernel: [11272]     0 11272    39154        0      80      336             0 sshd
Apr 26 04:18:15 elastichost kernel: [11277]     0 11277    28885        2      12      112             0 bash
Apr 26 04:18:15 elastichost kernel: [16070]   495 16070 47122631  3993992   15027   457699             0 java
Apr 26 04:18:15 elastichost kernel: Out of memory: Kill process 16291 (java) score 512 or sacrifice child
Apr 26 04:18:15 elastichost kernel: Killed process 16070 (java) total-vm:188490524kB, anon-rss:15975968kB, file-rss:0kB, shmem-rss:0kB
Apr 26 04:18:16 elastichost systemd: elasticsearch.service: main process exited, code=killed, status=9/KILL
Apr 26 04:18:16 elastichost systemd: Unit elasticsearch.service entered failed state.
Apr 26 04:18:16 elastichost systemd: elasticsearch.service failed.
The line “Free swap = 0kB” suggest the trigger of OOM is out of swap. So does ElasticSearch contribute to the swap shortage?
ElasticSearch was the main process on the VM and I noticed that the OS did not disable swap, which does not align with the best practice from ElasticSearch community. In order to find out whether Elastic Search is pushed to use swap, we can get the process ID:
pidof javaElasticSearch happens to be the only Java based process and the PID is 2283, the following command shows the swap usage by this process:
cat /proc/2283/status | grep VmSwapIf it shows a non-zero value, then ElasticSearch is using swap and you should expect some performance issues. We definitely should disable swap on ElasticSearch but does that solve the problem? Probably not because we didn’t address what caused the memory pressure in the first place. Disabling swap most likely makes ElastciSearch last longer before something else such as shortage of available memory triggers OOM.
In search for the source of memory shortage, I checked the result of free command and the top command. The free command (-mh) shows the following:
              total        used        free      shared  buff/cache   available
Mem:            31G         20G         10G        117M        243M         10G
Swap:          2.0G        249M        1.8G
I tried to follow my example from a previous post to make sense of the memory reads. When I monitor process with top and watch for RSS column, I cannot identify a single process that even takes more than a few hundred megabytes. I’ve downloaded a tool smem from epel repo, and the result of “smem -kt” suggest that the total RSS is about 372.2M:
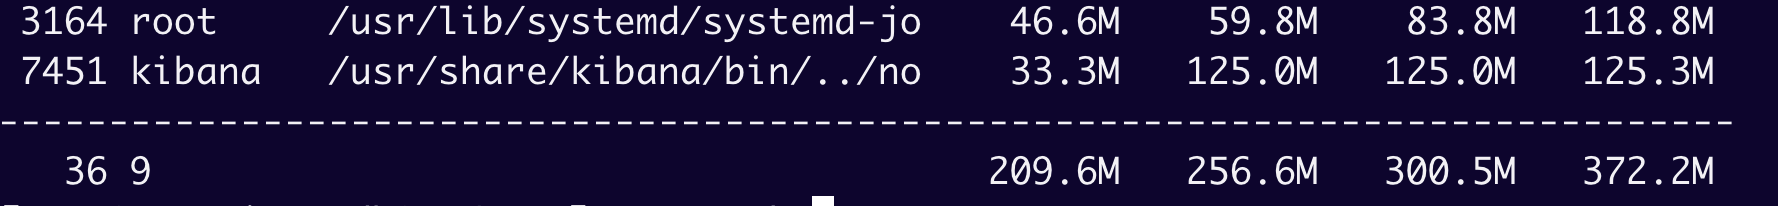
So there is about 19.6GB of memory usage unaccounted for. There is something that takes this much memory in the VM and haunting round even after OOM killer!
Inspired by this post, I was able to identify the culprit, that is the memory balloon. We don’t have access to the host but from the Guest OS, we can tell by vmware-toolbox-cmd (need to install yum package open-vm-tools):
vmware-toolbox-cmd stat balloonThe result displays a whopping 20807 MB as memory balloon! This needs to be sent to PaaS vendor for investigation but it is likely a result of memory over-allocation/over-commitment at host level, as well as the setup where the memory of guest is not reserved. Looking at the original log snippet, the line with “events_freezable vmballoon_work” is also an indicator of balloon causing the OOM.
Hypervisor needs memory ballooning to reclaim memory from guest. Since the guest OS does not expect the amount of physical memory to change, hypervisor has to maintain the illusion that the guest has its fixed amount of physical memory. The hypervisor first computes the amount of memory that needs to reclaim, then it leverage some low-level mechanism such as a balloon driver (a pseudo-device driver) installed on guest. The driver communicates with hypervisor and is told to allocate or de-allocate memory. If the driver is told to allocate memory to host, it tells the guest OS to pin the allocated pages into physical memory so they are locked and the physical memory available to guest OS is decreased. All these low level mechanisms explains why it is hard to account for memory consumption based on process running in Guest OS.
Memory balloon is a dynamic process and the hypervisor adjusts the size of balloon. However, the hypervisor, the guest OS and the application process (ElasticSearch in this case) may enter a nuance interaction:
- The hypervisor reclaims memory from guest OS (ballooning);
- Guest OS panicked with OOM exception;
- OOM picks a process to kill, based on oom_score. Unfortunately, the true culprit (balloon) is not visible to guest OS, hence exempted from being considered to kill.
- By killing the application process (usually the main application for VM), a fair chunk of guest memory is freed up;
- the balloon then became more aggressive on the guest as seeing more memory becomes “available”;
- the application on guest then does not have minimum memory on guest OS to start;
How to solve this problem? There are several things to consider. On the hypervisor, keep the entire or part of the guest memory reserved for start of application. Tune the OOM scoring so the non-critical application get killed. Implement application daemon, etc.