
Having been in transactional data world for almost the entire career, recently I have to pick up quite a few things to catch up on the analytical workload. The main purpose of data analytics project is to build analysis services models and manage deployed databases. Later in this post I’ll discuss some useful Azure resources for data analytics.
Data Model
Data are typically organized in relational model for better transactional performance, following the normalization forms. The relational model, however, might not be the most appropriate schema for analytics. In this case, it is better to use a separate non-relational repositories that can store information in a format that better aligns with its semantics, and hence more friendly to analytical applications.
A model consists of: data sources, tables, relationships, measures, KPIs, roles, etc. The model can be deployed to analysis database (e.g. SSAS). When deploying, queries (from source) and calculations are done.
Data modelling is the process of determining how your tables are related to each other. This process is done by defining and creating relationships between the tables. From that point, you can enhance the model by defining metrics and adding custom calculations to enrich your data. Creating an effective and proper data model is a critical step in helping organizations understand and gain valuable insights into the data. The model is another critical component that has a direct effect on the performance of your report and overall data analysis. The process of preparing data and modelling data is an iterative process.
Data Warehouse
Moreover, organizations have multiple data stores, with varying formats and different structures such as live stream, sensor, etc. They all need to be combined to generate insights. The process of combining all of the local data source is known as data warehousing. The process of analyzing streaming data and data from the Internet is known as Big Data Analytics.
A data warehouse gathers data from many sources within an organizations. This data is then used as the source for analysis, reporting and OLAP. The focus of a data warehouse is to provide answers to complex queries. A modern data warehouse might contain a mixture of relational and non-relational data, including files, social media streams, IoT sensor data.
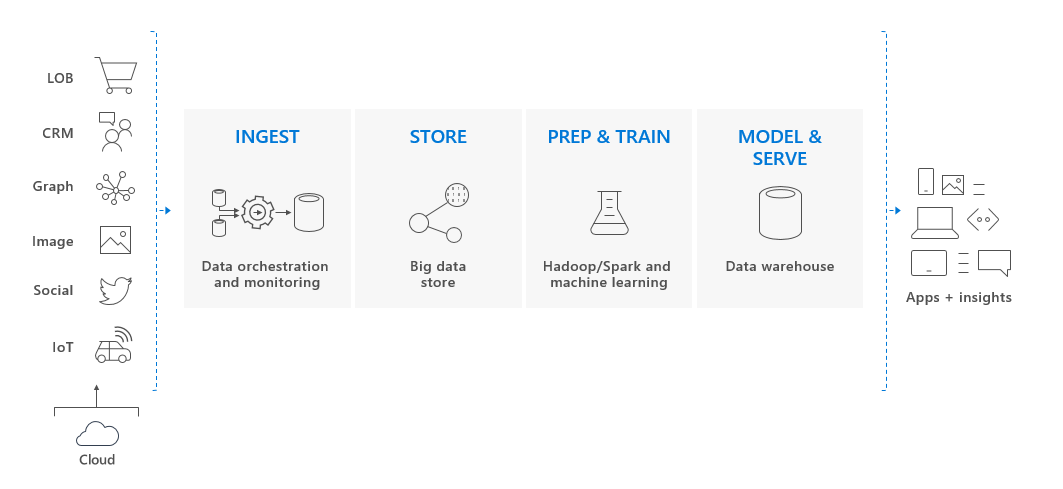
The diagram above is platform neutral. If you take Azure for example, a typical data warehouse platform involves the following components:
- Azure Data Factory: ingestion of data (integration service)
- Azure Data Lake Storage: store large quantity of data before analyzing
- Azure Databricks: other forms of data preparation (transformation, cleaning) by Spark
- Azure Synapse Analytics: store cleansed data, for Azure Analysis Service to consume
- Azure Analysis Service: query Synapse Analytics for detailed analysis and generate insights
- Power BI: Generate graphs, charts and reports by using information from Azure Analysis service
This is the diagram of those components as seen on Azure documentation:

Let’s discuss each components.
Azure Data Factory (ADF)
Big data requires a service that can orchestrate and operationalize process to refine the enormous stores of raw data into actionable business insights. ADF is managed cloud service built for complex hybrid ETL, ELT and data integration projects. ADF retrieves data from one or more data sources, and convert it into a format you can process. The data sources might present data in different ways, and contain noises that need to be discarded. For example, the source data may contain dates with bad format. ADF can unify the data structure. In ADF, you define the work performed as a pipeline of operations. A pipeline can run continuously, or triggered by schedule.
A linked service provides the information needed for ADF to connect to a source or destination. A pipeline is a logical grouping of activities that together perform a task.
The ADF UX (user interface experience) lets you visually author and deploy resources for your data factory without having to write any code. You can drag activities to a pipeline canvas, perform test runs, debug iteratively, and deploy and monitor your pipeline runs.
Azure Data Lake Storage (ADLS)
A data lake is a repository for large quantities of raw data. Because the data is raw and unprocessed, it’s very fast to load and update, but the data hasn’t been put into a structure for efficient analysis. You can think of a data lake as a staging point for your ingested data, before it’s massaged and converted into a format suitable for performing analytics. Note that a data warehouse also stores large quantities of data, but the data in a warehouse has been converted into a format for efficient analysis. Data lake holds raw data, whereas data warehouse holds structured information.
Azure Data Lake Storage is essentially an extension of Azure Blob storage, organized as a near-infinite file system. It supports POSIX file and directory structure for storage and RBAC. ADLS is also compatible with HDFS, a popular open-source solution to store large quantities of data.
Azure Databricks
Apache Spark is in-memory cluster computing technology, much faster than disk-based applications, and works with multiple programming languages to let you manipulate distributed data sets (DDS). There is no need to structure everything as map and reduce operations. Databricks develops a web-based platform for working with Spark cluster. It provides automated cluster management and IPython-style notebooks.
Azure Databricks is a managed Apache Spark environment running on Azure to provide big data processing, streaming, and machine learning. Apache Spark is a highly efficient data processing engine, with rich selections of libraries, that can consume and process large amounts of data very quickly. Azure Databricks also supports structured stream processing.
Delta Lake is an open-source storage layer in Azure Databricks that brings reliability to data lakes. Delta Lake provides ACID transactions, scalable metadata handling and unifies streaming and batch data processing. Delta Lake runs on top of your existing data lake and is fully compatible with Apache Spark APIs.
Azure Synapse Analytics
Azure Synapse is an end-to-end solution. It unifies data analysis, integration and orchestration, Data Lake, Data Warehouse, ELT/ELT, ML capabilities and visualization. With Synapse, you can process large amounts of data very quickly. You can ingest data from external sources (e.g. flat file, ADLS, other DBMS) and then transform and aggregate the data into a format suitable for analytics processing. You can also use this data as input to further analytical processing using Azure Analysis Services. Azure Synapse is a comprehensive service with the following components:
- Synapse Analytics – a successor of SQL DW technology. Synapse analytics has inherited its MPP capability.
- Data Exploration – Synapse Studio makes data exploration in Data lakes, SQL engine and Spark very easy.
- Data Integration – inherited ADF’s data movement and transformation components, which allows building complex ETL pipelines without code
- Development – supports Spark, Python, Scala, Spark notebooks, SQL
- Data visualization – Synapse Studio allows user to connect to Power BI workspace and get the same report development experience
The most critical component, Synapse Analytics is analytics engine, designed to process large amounts of data very quickly. Synapse Analytics leverages a MPP (massively parallel processing) architecture, including a control node and a pool of compute nodes. When you submit a processing request, the control node transforms it into smaller requests and send them to compute nodes. Each compute node runs the queries over the portion of data that they each hold. When each node has finished its processing, the results are sent back to the control node where they’re combined into an overall result.
Synapse Analytics supports two computational models: SQL pools and Spark pools. In a SQL pool, each compute node uses an Azure SQL Database and Azure Storage to handle a portion of the data. You can submit queries in the form of T-SQL statement. Synapse Analytics uses a technology named PolyBase to retrieve data from a wide variety of sources (e.g. Blob, ADSL, CSV). You can save the data read in as SQL tables in Synapse Analytics service. In a Spark pool, the nodes are replaced with Spark cluster. You run Spark jobs comprising code written in Notebooks (in Python, Scala, or Spark SQL). The Spark cluster splits the work out into a series of parallel tasks that can be performed concurrently. You can save data generated by your notebooks in Azure Storage or ADLS. To scale Spark pool, you can specify the cluster size, or turn on autoscaling.
Azure Analysis Service (AAS)
AAS is a fully managed PaaS that enables you to build tabular models to support OLAP queries. You can combine data from multiple sources (e.g. Azure SQL Database, ADLS, Cosmos DB, etc). You use those data sources to build models that incorporate your business knowledge. A model is essentially a set of queries and expressions that retrieve data from various data sources and generate results. The results can be cached in-memory for later use, or they can be calculated dynamically, directly from underlying data sources. AAS has significant functional overlap with Synapse Analytics, but it’s more suited for processing on a smaller scale. The comparison below outlines the difference:
| Synapse Analytics | Azure Analysis Service (AAS) |
| – very high volumes of data (multi-terabyte to petabyte sized datasets) – very complex queries and aggregations – data minding, and data exploration – complex ETL operations – low to mid concurrency (127 users or fewer) | – smaller volumes of data (a few terabytes) – multiple resources that can be correlated – high read concurrency – detailed analysis, and drilling into data, using functions in Power BI – rapid dashboard development from tabular data |
Many scenarios can benefit from using Synapse Analytics and Analysis Services together. If you have large amounts of ingested data that requires preprocessing, you can use Synapse Analytics to read this data and manipulate it into a model that contains business information rather than a large amount of raw data. The scalability of Synapse Analytics gives it the ability to process and reduce many terabytes of data down into a smaller, succinct dataset that summarizes and aggregates much of this data. You can then use AAS to perform detailed interrogation of this information, and visualize the results of these inquiries with Power BI.
Azure HDInsight
Azure HDInsight is a managed analytics service based on Apache Hadoop, a collection of open-source tools and utilities that enable you to run processing tasks over large amounts of data. HDInsight uses a clustered model, similar to that of Synapse Analytics. HDInsight stores data using ADLS. You can use HDInsight to analyze data using frameworks such as Hadoop Map/Reduce, Apache Spark, Apache Hive, Apache Kafka, Apache Storm and more.
Power BI
Microsoft PowerBI is a collection of software services, apps and connectors. It consists of a Microsoft Windows Desktop application Power BI Desktop, an online SaaS service Power BI service, and mobile Power BI apps available on any device. These three elements are designed to let people create, share and consume business insights. A common workflow with Power BI can be outlined as:
- Bring data into Power BI Desktop, and create a report
- Publish to the Power BI service, where you can create new visualizations or build dashboards
- Share dashboard with others, especially people who are on the go
- View and interact with shared dashboards and reports in Power BI mobile apps.
Basic building blocks in Power BI include:
- visualizations: chart, colour-coded map, etc
- datasets;
- reports: a collection of visualizations that appear together on one or more pages;
- dashboards: when you’re ready to share a report, or a collection of visualizations, you create a dashboard, much like the dashboard in a car, a Power BI dashboard is a collection of visuals from a single page that you can share with others. Often, it’s a selected group of visuals that provide uick insight into the data or story you’re trying to present.