
In the 60s, automobiles manufactured in Japan consistently beats their competitors in American market. Many refers to the lean manufacturing methodology in the automation as the secret sauce. The software industries borrowed a lot of similar methodologies from TPS (Toyota Production System) into software development industry, which brought about agile software development.
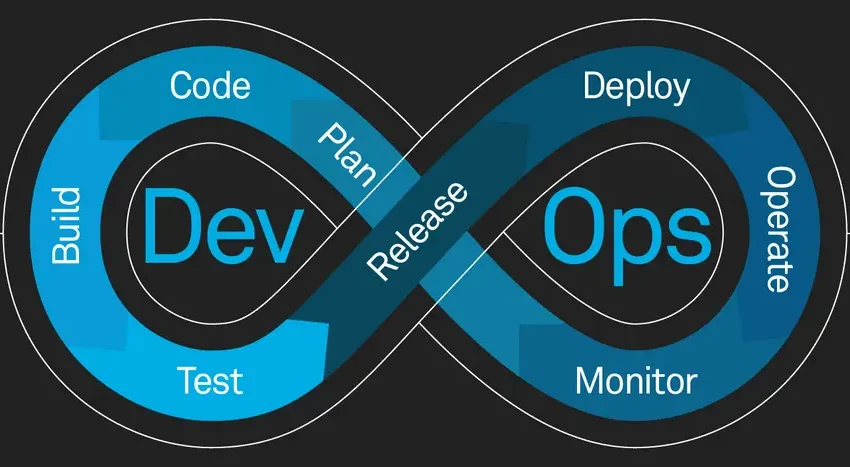
For software to deliver value, it is not just about developing software in agile methodologies. A full SDLC (software development life cycle) includes build, release and upgrades too, some of which are managed in a different department in the organization. DevOps extends agile methodology across departments. DevOps has now become a buzzword. Some even refers to it as a culture but none of these are possible without automation.
Automation Pipelines
The power horse of the DevOps tooling is automation pipeline (e.g. Jenkins, Azure DevOps, GitHub). These pipelines expedites iterations with frequent feedback about software quality, whether it is common conventional SDLC workflow or more recent infrastructure as code worklfow. For SDLC, the goal is to establish continuous integration (CI) and ultimately continuous deployment (CD).
Serverless Deployment
With serverless deployment, the operation of managing computing resources is abstracted away. Serverless deployment models further simplifies SDLCs and are ideal for some common use cases such as API services, IoT, scheduled and event-driven tasks.
DataOps
Another creative use of automation pipelines is the data pipelines. Data engineering tasks includes ingestion, ETL, integration, and storage and automation pipelines are ideal automation tools for these tasks.
Observability
Observability setup enables instant feedback, an important construct of DevOps. An observability stack consists of metrics collection, log shipping, performance monitoring, request tracing and visualization etc.
More on automation
- The Leanest Web and Email Hosting - This site has been quiet for a while. During this time, I migrated the hosting platform again, and refactored email solution. This post, is another note about how I finally came to the most cost-effective web and email solution for a small business, with a solid security posture, and at…
- Debating between count and for_each in Terraform - In Terraform, we often have to create an array of resources of the same type but similar attribute values. For code reusability, manageability and for DRY principle, it's better to use loop. Terraform HCL supports loop via the use of meta-argument. Currently, there are two options to drive a loop:…
- Test Open ID Connect Flows Locally - Earlier this year, I had to integrate an application with an identity provider. Both claim to be compliant with Open ID Connect. But when they don't get along, I must find out where it breaks to determine which party isn't compliant. Therefore, I had to really get to the transaction-level…
- IAM Roles for any workload - Background A few month back a client of mine wanted to use GitLab pipeline to deploy infrastructure on AWS with Terraform. The key question is how to authenticate the Terraform process running in the pipeline to AWS with temporary credential. Having worked it out on GitHub, my proposal at time…
- Managing EC2 instances across accounts with Ansible - I regard AWS Systems Manager as omnipotent. Nonetheless, there are a few reasons that makes Ansible still a prevalent VM (EC2) management tool over Systems Manager (SSM). First, organizations already vested in their custom Ansible roles and playbooks want to reuse, and expand their assets in Ansible. The benefit is…
Contact Digi Hunch for Professional Services.