

I first worked on log shipping with ELK stack three years ago. In the context of Kubernetes cluster, log shipping has similar challenges. In this post I will discuss the set up of log shipping with Kubernetes cluster using EFK stack
Logging Architecture
As discussed, if the Kubernetes cluster has a runtime in compliant with CRI (e.g. containerd), then the stdout and stderr of the Pod is stored on the node, in the location /var/log/containers/.
When creating log shipping solution, it is important to use a compliant cluster (e.g. minikube) to ensure what you develop will work across environments.
The Kubernetes document has a section on logging architecture which is a good start point. It outlines several different patterns. Logging at the node level is turned on by default and does not require special configuration, as explained in the section above. The EFK pattern is close to the diagram under using a node logging agent for cluster-level logging.
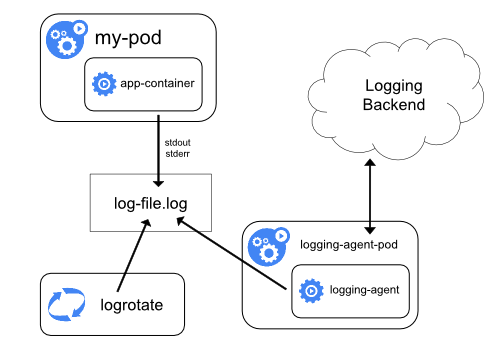
The diagram above is stolen from Kubernetes documentation. In EFK stack, the agent is a daemonset running fluentd Pod.
EFK stack
While we can use ELK (Elasticsearch, Logstash, Kibana) stack for log shipping, EFK (Elasticsearch, Fluentd, Kibana) is generally recommended in Kubernetes cluster. We compare the two in the following table:
| ELK | EFK | |
| Development language | All in Java. Logstash and Filebeat both require JVM. Managed as an open-source project by Elastic company | Fluentd in Ruby and does not require JVM to run. Fluentd is a CNCF project built to integrate with Kubernetes. |
| Typical pattern | Filebeat acts as a lightweight collector to monitor the source log. Logstash as aggregator to receive from filebeat, and push to Elasticsearch | The fluentd Pod can be configured to serve as forwarder and aggregator based on configuration. fluentd-forwarder is deployed as daemonset on node, and ship the result to fluentd-aggregator, which may run in a separate cluster. The fluentd-aggregator pushes processed results to Elasticsearch. |
| Metrics | use metric beat for data collection | scrape metrics from prometheus server |
| Event Routing | tag-based | if-then statement |
The main problems in log shipping are:
- column mapping : identify column patterns in each log line and map them to appropriate column in Elasticsearch.
- multi-line processing: identify when a logging entry spread across multiple lines and process accordingly.
Suppose we want to congregate the logs from stdout and stderr of PostgreSQL pods. The raw output in /var/log/container on the node, looks like this:
2021-08-28T15:27:46.75370563Z stdout F server stopped
2021-08-28T15:27:46.757173069Z stderr F postgresql-repmgr 15:27:46.75 INFO  ==> Starting PostgreSQL in background...
2021-08-28T15:27:46.883126928Z stderr F postgresql-repmgr 15:27:46.88 INFO  ==> Registering Primary...
2021-08-28T15:27:47.017164653Z stderr F postgresql-repmgr 15:27:47.01 INFO  ==> Loading custom scripts...
2021-08-28T15:27:47.023334611Z stderr F postgresql-repmgr 15:27:47.02 INFO  ==> Loading user's custom files from /docker-entrypoint-initdb.d ...
2021-08-28T15:27:47.026169813Z stderr F postgresql-repmgr 15:27:47.02 INFO  ==> Starting PostgreSQL in background...
2021-08-28T15:27:47.343607487Z stderr F postgresql-repmgr 15:27:47.34 INFO  ==> Stopping PostgreSQL...
2021-08-28T15:27:47.448111425Z stdout F waiting for server to shut down.... done
2021-08-28T15:27:47.448172479Z stdout F server stopped
2021-08-28T15:27:47.453722807Z stderr F postgresql-repmgr 15:27:47.45 INFO  ==> ** PostgreSQL with Replication Manager setup finished! **
2021-08-28T15:27:47.453829953Z stdout F
2021-08-28T15:27:47.503516746Z stderr F postgresql-repmgr 15:27:47.50 INFO  ==> Starting PostgreSQL in background...
2021-08-28T15:27:47.532558987Z stdout F waiting for server to start....2021-08-28 15:27:47.532 GMT [273] LOG:  pgaudit extension initialized
2021-08-28T15:27:47.533307459Z stdout F 2021-08-28 15:27:47.533 GMT [273] LOG:  listening on IPv4 address "0.0.0.0", port 5432
2021-08-28T15:27:47.533466407Z stdout F 2021-08-28 15:27:47.533 GMT [273] LOG:  listening on IPv6 address "::", port 5432
2021-08-28T15:27:47.537987947Z stdout F 2021-08-28 15:27:47.537 GMT [273] LOG:  listening on Unix socket "/tmp/.s.PGSQL.5432"
2021-08-28T15:27:47.547956465Z stdout F 2021-08-28 15:27:47.547 GMT [273] LOG:  redirecting log output to logging collector process
2021-08-28T15:27:47.548005463Z stdout F 2021-08-28 15:27:47.547 GMT [273] HINT:  Future log output will appear in directory "/opt/bitnami/postgresql/logs".
2021-08-28T15:27:47.551741571Z stdout F 2021-08-28 15:27:47.551 GMT [275] LOG:  database system was shut down at 2021-08-28 15:27:47 GMT
2021-08-28T15:27:47.558012894Z stdout F 2021-08-28 15:27:47.557 GMT [273] LOG:  database system is ready to accept connections
2021-08-28T15:27:47.618577092Z stdout F  done
2021-08-28T15:27:47.618708978Z stdout F server started
2021-08-28T15:27:47.630065958Z stderr F postgresql-repmgr 15:27:47.62 INFO  ==> ** Starting repmgrd **
2021-08-28T15:27:47.638116348Z stderr F [2021-08-28 15:27:47] [NOTICE] repmgrd (repmgrd 5.2.1) starting up
2021-08-28T15:27:47.65317627Z stderr F INFO:  set_repmgrd_pid(): provided pidfile is /opt/bitnami/repmgr/tmp/repmgr.pid
2021-08-28T15:27:47.653232015Z stderr F [2021-08-28 15:27:47] [NOTICE] starting monitoring of node "orthweb-postgresql-ha-postgresql-0" (ID: 1000)
2021-08-28T15:27:47.681683703Z stderr F [2021-08-28 15:27:47] [NOTICE] monitoring cluster primary "orthweb-postgresql-ha-postgresql-0" (ID: 1000)
2021-08-28T15:28:11.742865958Z stderr F [2021-08-28 15:28:11] [NOTICE] new standby "orthweb-postgresql-ha-postgresql-1" (ID: 1001) has connected
From this snippet of log, we can see each line in stdout or stderr is appended with a timestamp. There are multi-line log entries but each is still appended with a timestamp. This is just how kubernetes keeps the log file for Pod stdout and stderr. To handle that, we need to first take out the real log line, and then process multi-line.
We will go over the installation of EFK stack and the mechanism to address the two challenges above.
Install Elasticsearch and Kibana
To install Elasticsearch, we use the helm chart provided by the official repository:
helm repo add elastic https://helm.elastic.co
If we run multiple pods on the same hosts, then we need some customized values in order to get the installation to work. The values.yaml file looks like this:
---

antiAffinity: "soft"

esJavaOpts: "-Xmx128m -Xms128m"

# Allocate smaller chunks of memory per pod.
resources:
  requests:
    cpu: "100m"
    memory: "512M"
  limits:
    cpu: "1000m"
    memory: "512M"
Then we can “preview” what values are used for installation, with helm’s template command:
helm template elasticsearch elastic/elasticsearch -f values.yaml
The effect of the antiAffinity property allows multiple Elasticsearch Pod to be scheduled on the same node. This is not required in production with multiple nodes. To install Elasticsearch and Kibana, run:
helm install elasticsearch elastic/elasticsearch -f values.yaml
helm install kibana elastic/kibana
The Kibana service is exposed on port 5601 of the cluster. To access the port on cluster, we need to run port-forward command as below:
kubectl port-forward deployment/kibana-kibana 5601
Install Fluentd
There are different ways to configure Fluentd. For example, in the forwarder-aggregator pattern, a forwarder Pod is a Daemonset on each Kubernetes node. The forwarder pushes to the aggregator, at port 24224. This page has some configuration details. This pattern is similar to filebeat -> logstash pattern in ELK stack.
In our case, we use a simplified pattern, with a fluentd daemonset acting as collector and then forward to Elasticsearch. Similarly, in ELK stack we can use filebeat to push to Elasticsearch without Logstash. The only reason is the entire architecture isn’t as complicated as requiring an aggregator.
We need to create configmap as below:
kind: ConfigMap
apiVersion: v1
metadata:
  name: fluentd-cm
  namespace: default
  labels:
    app.kubernetes.io/component: forwarder
    app.kubernetes.io/instance: fluentd
    app.kubernetes.io/managed-by: Helm
    app.kubernetes.io/name: fluentd
    helm.sh/chart: fluentd-1.3.0
  annotations:
    meta.helm.sh/release-name: fluentd
    meta.helm.sh/release-namespace: default
data:
  fluentd.conf: |
    # Ignore fluentd own events
    <match fluent.**>
        @type null
    </match>

    # HTTP input for the liveness and readiness probes
    <source>
        @type http
        port 9880
    </source>

    # Throw the healthcheck to the standard output instead of forwarding it
    <match fluentd.healthcheck>
        @type null
    </match>

    # Get the logs from the containers running in the node
    <source>
      @type tail
      read_from_head true
      tag kubernetes.*
      path /var/log/containers/orthweb-postgresql-ha-postgresql-**.log
      pos_file /opt/bitnami/fluentd/logs/buffers/fluentd-docker.pos
      <parse>
        @type regexp
        expression ^(?<time>\d{4}-\d{2}-\d{2}T\d{2}:\d{2}:\d{2}.[^Z]*Z)\s(?<stream>[^\s]+)\s(?<character>[^\s])\s(?<message>.*)$
      </parse>
    </source>
        # enrich with kubernetes metadata
    <filter kubernetes.**>
      @type kubernetes_metadata
      @id filter_kube_metadata
      kubernetes_url "#{ENV['FLUENT_FILTER_KUBERNETES_URL'] || 'https://' + ENV.fetch('KUBERNETES_SERVICE_HOST') + ':' + ENV.fetch('KUBERNETES_SERVICE_PORT') + '/api'}"
      verify_ssl "#{ENV['KUBERNETES_VERIFY_SSL'] || true}"
      ca_file "#{ENV['KUBERNETES_CA_FILE']}"
      skip_labels "#{ENV['FLUENT_KUBERNETES_METADATA_SKIP_LABELS'] || 'false'}"
      skip_container_metadata "#{ENV['FLUENT_KUBERNETES_METADATA_SKIP_CONTAINER_METADATA'] || 'false'}"
      skip_master_url "#{ENV['FLUENT_KUBERNETES_METADATA_SKIP_MASTER_URL'] || 'false'}"
      skip_namespace_metadata "#{ENV['FLUENT_KUBERNETES_METADATA_SKIP_NAMESPACE_METADATA'] || 'false'}"
    </filter>


    <match kubernetes.var.log.containers.orthweb-postgresql-ha-postgresql-**.log>
      @type elasticsearch
      include_tag_key true
      host "elasticsearch-master.default.svc.cluster.local"
      port "9200"
      index_name "postgresql-logs"
      <buffer>
        @type file
        path /opt/bitnami/fluentd/logs/buffers/orthanc-logs.buffer
        flush_thread_count 2
        flush_interval 5s
      </buffer>
    </match>
Then we can create the resource, with helm chart pointing to the config map:
helm install fluentd bitnami/fluentd --set aggregator.enabled=false --set forwarder.configMap=fluentd-cm
We can validate the index creation on Elasticsearch:
kubectl port-forward service/elasticsearch-master 9200
curl -XGET localhost:9200/_cat/indices
From Kibana, we can forward the port as instructed above, and browse to the UI. Once logged on to Kibana, we need to add index pattern first before being able to view the content of index.
How about Fluent Bit
Fluentd has an even more lightweight brother Fluent Bit, also a CNCF project, designed by the same team, for environments with tighter resource restrictions. The technical differences are outlined on this page outlines the technical differences. In terms of use case, Fluentd is a log aggregator and Fluent Bit is simply a forwarder. In terms of ecosystem, Fluentd has a stronger ecosystem whereas Fluent Bit is more seen in IoT devices. Read this post for more comparison.
Summary
EFK stack (Elasticsearch, Fluentd and Kibana) on Kubernetes is a natural choice for ELK users. Fluentd is a CNCF project created for integration with Kubernetes. It is good alternative to enterprise solution such as Splunk. There are lots of plugins supported and articles on configuration. While developing a solution I had to spend time reading the input plugin documentations.