
Tuning the garbage collector is the most important thing that can be done to improve the performance of a Java application. GC is typically caused when the JVM decides GC is necessary, specifically when:
- a minor GC will be triggered when the new generation is full;
- a full GC will be triggered when the old generation is full;
- a concurrent GC (if applicable) will be triggered when the heap starts to fill up
OpenJDK has three collectors suitable for production, with different performance characteristics. In order to study the GC behaviours in application, it is important to turn on GC logging. The detailed step is different in JDK 8 and JDK 11 (read about java version here).
Java developers don’t need to manage life cycle of objects explicitly as the JVM automatically fress the object. In order to track objects that are still in use, it is insufficient to count references to objects. Instead, the JVM must periodically search the heap for unused objects. Once it finds unused objects, the JVM frees the memory occupied by those objects. It also needs to compact the memory to prevent memory fragmentation. The performance of GC is dominated by these basic operations (finding unused objects; freeing up their memory; compacting the heap), no matter which collector is used. Some algorithms delay compaction until absolutely necessary, some compact entire sections of the heap at a time, and some compact the heap by relocating small amounts of memory at a time. These different approaches are why different algorithms have different performance characteristics.
Java programs are typically heavily multithreaded, and the garbage collector itself often runs multiple threads too. We refer to the application logic threads as mutator threads, since they are mutating objects as part of the application logic. When GC threads track object references or move objects around in memory, they must make sure application threads are not using those objects on the move. This introduces a pause when all application threads are stopped (known as stop-the-world pauses), which generally has the greatest impact on the performance of an application. Minimizing those pauses is one important consideration when tuning GC.
Garbage collectors are generational
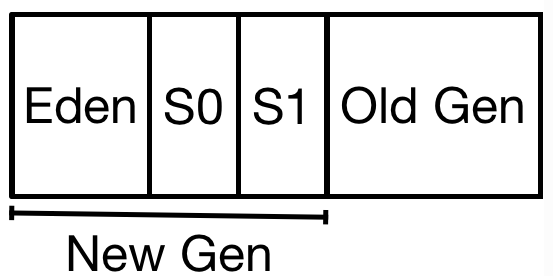
Most garbage collectors work by splitting the heap into generations. These are called the old (or tenured) generation, and the young generation, which is further divided into sections known as eden and survivor spaces, with eden taking up the vast majority of the young generation. The rationale for having separate generations is that many objects are used for a very short period of time in the real life of application programming. Garbage collector is designed to take advantage of this. Objects are first allocated in the young generation, which is a subset of the entire heap. When the young generation fills up, the garbage collector will stop all the application threads and empty out the young generation. Objects that are no longer in use are discarded, and objects that are still in use are moved elsewhere. This operation is called a minor GC or a young GC. Common GC algorithms have stop-the-world pauses during collection of the young generation.
This design has two performance advantages. First, Cleaning up young generation as a only a portion of the entire heap causes shorter pause than cleaning up the entire heap. Second, by moving used objects to survivor spaces or old generation, and discarding unused objects, compatction is achieved.
With used objects moved to the old generation, eventually it woo will fill up, and the JVM will needt o find any objects within the old generation that are no longer in use to discard. This is where GC algorithms have their biggest differences. The simpler alghorithms stop all application threads, find the unused objects, free their memory, and then compact the heap. This process is called a full GC, and it generally causes a relatively long pause for the application threads.
On the other hand, sophisticated alghrithms are able to find unused objects while application threads are running. These algorithms are called concurrent collectors, or low-pause collectors. A concurrent collector typically allows an application to experience fewer and shorter pauses. The biggest trade-off here is the overall CPU required by the sophisticated algorithms.
The three main algorithms
Serial GC is the simplest and the default for single core host (e.g. client-class machine, single-processor VM or Docker container). The serial collector uses a single thread to process the heap. It will stop all application threads as the heap is processed (for either a minor or full GC). During a full GC, it will fully compact the old generation. The serial collector is enabled by using the -XX:+UseSerialGC flag.
The throughput collector (aka parallel collector) is the default collector for any 64-bit machine with two or more CPUs. The throughput collector uses multiple threads to collect the young generation, which makes minor GCs much faster than when the serial collector is used. This uses multiple threads to process the old generation as well. The throughput collector stops all application threads during both minor and full GCs, and it fully compacts the old generation during a full GC. Since it is the default in most situations where it would be used, it needen’t be expliticly enabled. To enable it where necessary, use the flag -XX:+UseParallelGC
The G1 GC (or garbage first garbage collector) uses a concurrent collection strategy to collect the heap with minimal pauses. It is the default collector in JDK 11 and later for 64-bit JVMs on machines with two or more CPUs. G1 GC divides the heap into regions, but it still considers the heap to have two generations. Some of those regions make up the young generation, and the young generation is still collected by stopping all application threads and moving all objects that are alive into the old generation or the survisor spaces, using multiple threads. In G1 GC, the old generation is processed by background threads that don’t need to stop the application threads to perform most of their work.
In G1 GC, the old generation is processed by background threads that don’t need to stop the application threads to perform most of their work. Because the old generation is divided into regions, G1 GC can clean up objects from the old generation by copying from one region into another, which means that it compacts the heap during normal processing. This helps keep G1 GC heaps from becoming fragmented.
The trade-off for avoiding the full GC cycles is CPU time; the multiple background threads G1 GC uses to process the old generation requires CPU cycles available at the same time the application threads are running. G1 GC is enabled by specifying the flag -XX:+UseG1GC. It is the default in JDK 11, and functional in JDK 8 as well, with some performance feature missing.
In all cases, GC is caused when the JVM decices GC is necessary; a minor GC will be triggered when the new generation is full; a full GC will be triggered when the old generation is full, or a concurrent GC (if applicable) will be triggered when the heap starts to fill up. Java also provides a mechanism for applications to force a GC to occur: the System.gc() method, although it is always a bad idea to call that method explicitly because it triggers a full GC which hangs the application threads. This method can be disabled by including -XX:+DisableExplicitGC in the JVM arguments.
As to choosing GC algorithm, the rule of thumb is that G1 GC is the better choice. However, in JDK 8, the ability of G1 GC to avoid a full GC is also a key consideration. In this case we may need to choose betwen serial collectors and throughput collectors, based on the number of CPUs on the machine.
The serial collector makes sense when running CPU-bound applications on a machine with a single CPU, even if that single CPU is hyper-threaded. The throughput collector makes sens on multi-CPU machines running jobs that are CPU bound. Even for jobs that are not CPU bound, the throughput collector can be the better choice if it does relatively few full GCs or if the old generation is generally full.
Basic GC tuning
Sizing the heap
If the heap is too small, the program will spend too much time performing GC and not enough time performing application logic. On the contrary, a very large heap will increase the time spent in GC pauses, even thought the pauses occur less frequently. It is also potentially dangerous due to interaction with memory swap. If a Java program with a 12 GB heap is running on a system where swap is enabled, the OS may handle it by keeping 8GB of the heap in RAM and 4GB on disk. The JVM does not know about this because swapping is handled by the OS. The JVM will happily fill up all 12GB of heap it has been told to use. This can cause a sever performance penalty when OS swaps data from disk to RAM. Worse, the one time this swapping is guaranteed to occur is during a full GC, when the JVM must access the entire heap. Swapping during full GC makes the pause an order of magnitude longer.
So heap size (total for all JVMs) should never exceed the amount of physical memory on the machine. Size of heap is controled by two values (Xms as initial value and Xmx as maximum value). Having an initial and maximum size for the heap allows the JVM to tune its behaviour depending on the workload. If the JVM sees that it is doing too much GC, with the initial heap size, it will continually increase the heap until the JVM is doing the “correct” amount of GC, or until the heap hits its maximum size.
A good rule of thumb is to size the heap so that it is 30% occupied after a full GC. To calculate this, start your application and push it to high load. Then connect to the application with jconsole, force a full GC, and observe how much memory is used when the full GC completes.
Sizing the generations
The JVM must also decide how much of the heap to allocate respectively to they young generation and old generation. THe JVM usually does this automatically and usually does a good job in determining the optimal ratio. In some cases you might hand-tune these values.
In general, if there is a relatively larger young generation, young GC pause times will increase, but the young generation will be collected less often, and fewer objects will be promoted into the old genration. But on the other hand, older generation will be relatively smaller and fill up more frequently and do more full GCs. The command-line flag to tune the generation sizes are:
-XX:NewRatio=N
-XX:NewSize=N
-XX:MaxNewSize=N
-Xmn N
The size of initial young generation is determined by initial heap size and new ratio:
Initial Young Gen Size = Initial Heap Size / (1 + NewRatio)
The young generation will grow in tandem with the overall heap size, but it can also fluctuate as a percentage of the total heap (based on the initial and maximum size of the young generation). Adaptive sizing controls how the JVM alters the ratio of young genration to old gneeration within the heap. It should be kept enabled in general. For finely tuned heaps, adaptive sizing can be disabled for a small performance boost.
Sizing the metaspace
When the JVM loads classes, it must keep track of certain metadata about those classes. This occupies a separate heap space called the metaspace. In older JVMs this was handled by a different implementation called permgen. To end users, the metaspace is opaque. It does not hold the actual instance of the class. The objects are held in the regular heap. Information in the metaspace is used only by the compiler and JVM runtime, and the data it holds is referred to as class metadata.
Tuning the metaspace is fairly rare these days because the default values for the size of metaspace are very generous. It is sized dynamically based on an initial size (-XX:MetaspaceSize=N) and will increase as needed to a maximum size (-XX:MaxMetaspaceSize=N).
Resizing the metaspace requires a full GC, so it is an expensive operation. If there are a lot of full GCs during the startup of a program (as it it loading classes), it is often because permgen or metaspace is being resized, so increasing the initial size is a good idea to improve startup in that case.
Controlling Parallelism
All GC alghorithms except the serial collector use multiple threads. The number of these threads is controlled by the -XX:ParallelGCThreads=N flag. Bacuase these GC operations stop all application threads from executing, the JVM attempts to use as many CPU resources as it can in order to minimize the pause time. By default, that means the JVM will run one thread for each CPU on a machine, up to eight. Once that threashold has reached, the JVM adds new thread for only every 1.6 CPus. Sometimes this number is too large relative to the heap size and hand tuning is needed.
Reference: Java Performance by Scott Oaks
This post also contains some helpful information, where the original Oracle white paper about GC was cited. Further than GC, this website from Oracle describes more about JVM.