
We’ve checked out the the actors in PLG stack (Promtail, Loki, Node Exporter, Prometheus, Grafana) and whipped up a quick pipeline on MacOS. Now I’m going a little further to implement the same PLG stack (Prometheus Loki and Grafana) in a Kubernetes cluster. This setup is for demo only, therefore no persistent storage is enabled.
Test Workload
I host a deployment of Flog with three pods running on Minikube. Flog is an open-source emulating log generation behaviour of an application. On the Minikube cluster we start the deployment as below:
minikube start --driver=hyperkit --container-runtime=containerd --memory=12288 --cpus=2
kubectl create ns obsv
kubectl -n obsv create deployment flog --image=mingrammer/flog --replicas=3 -- flog -f rfc3164 -l -d 300ms
kubectl -n obsv get po
The Pods will come up in a heartbeat.
I will use helm to install the objects required for logging and metrics pipelines. There are multiple Helm charts for each components. Some high-level charts (usually with a name suffix of -stack) contain several other resource as sub-charts. They are created as one-stop-shop for multiple components but I found none of them serve my exact purpose. For example, both loki-stack and kube-prometheus-stack include Grafana. But I only need one instance of Grafana. Therefore I stick to the low-level charts.
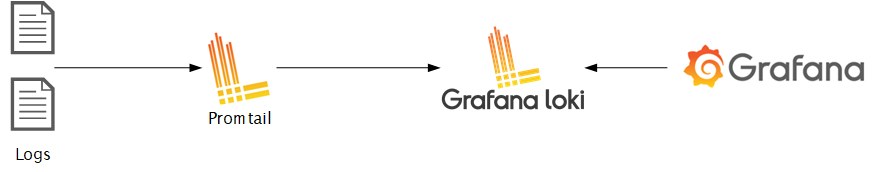
Log Shipping
Add a helm repo, and install loki and promtail. Note that we need to specify correct loki address when installing Promtail.
helm repo add grafana https://grafana.github.io/helm-charts
helm repo update
helm upgrade --namespace obsv --install loki grafana/loki
helm upgrade --namespace obsv --install promtail grafana/promtail --set "config.lokiAddress=http://loki.obsv.svc.cluster.local:3100/loki/api/v1/push"
When installing Promtail, a DaemonSet is created on the Node. The default configuration applies appropriate configuration and tagging strategy for Kubernetes Pod and Node. So the only customization I specified is Loki address. We can then check logging with Loki. To do so, first expose port 3100 to host, and then use logcli (e.g. on MacOS) to query for logs:
kubectl -n obsv port-forward service/loki 3100:3100
logcli labels
logcli labels pod
logcli query '{pod="flog-775d5fc5c8-p4rlx"}'
Log lines should be pumped to Loki a minute after Loki comes up. The logcli labels command should display the tags. The logcli query command should return the log lines.
Metrics
I use Premetheus with node exporter. In its architecture, Prometheus contain the server, the pushgateway, and alertmanager. The helm chart for Prometheus contains all of those components. It also has a dependency repo for kube-state-metrics. To install:
helm repo add prometheus-community https://prometheus-community.github.io/helm-charts
helm repo add kube-state-metrics https://kubernetes.github.io/kube-state-metrics
helm --namespace=obsv install prometheus prometheus-community/prometheus
kubectl -n obsv get svc
Once installed, a DaemonSet for Prometheus Node Exporter is created. The exporter is already configured by default for Kubernetes monitoring. The Prometheus server is also configured, on port 80 by default. it needs to be forwarded in order to access from Browser:
kubectl --namespace obsv port-forward service/prometheus-server 9100:80
To verify installation of Prometheus, browse to localhost:9100 to examine the metrics.
Visualization
Last but not least, I will configure Grafana. The repo has been added already so we’ll just install the chart:
helm upgrade --namespace obsv --install grafana grafana/grafana
kubectl get secret --namespace obsv grafana -o jsonpath="{.data.admin-password}" | base64 --decode ; echo
The second command retrieves the credential. To access the web portal, we need port forwarding again:
kubectl port-forward --namespace obsv service/grafana 3000:80
To verify installation, browse to http://localhost:3000 and log in as user admin with the password above. Then add two data sources:
- Type: Prometheus, URL: http://prometheus-server.obsv.svc.cluster.local:80
- Type: Loki, URL: http://loki.obsv.svc.cluster.local:3100
Then we can explore data using both data sources.
Summary
In the last two posts I reviewed the setups for PLG stack in Kubernetes, from a regular environment to k8s cluster. Fluentd, Prometheus are both CNCF projects. The PLG stack seems to be more adopted than EFK but both have their own advantages. Welcome to the PLG vs EFK debate.