
Last month we discussed log shipping with EFK. This week I spent sometime checking out its alternative Loki. Having been exposed to the ELK stack extensively, I am also interested in exploring the counterparts in this new stack, such as Prometheus, Loki and Grafana. So I need to address the issues of shipping both metrics and logs.
Let’s start by clarifying the terms:
- Grafana is a visualizer. It supports many backends such as Prometheus, Loki, Elasticsearch, CloudWatch and Azure Monitor. It is the flagship product of Grafana Labs.
- Prometheus is a time-series database and alerting platform. To push metrics to Premethus, you can either integrate your application with client library (in their term, instrumenting), or configure an existing exporters for a third party application such as PostgreSQL. Prometheus collects and stores its metrics as time series data ( i.e. metrics information is stored with the timestamp at which it was recorded, alongside optional key-value pairs called labels) and it comes with basic visualization capability. Premetheus is a CNCF project since 2016 and is maintained by Grafana Labs.
- Loki is a log aggregation system, also developed by Grafana Labs. Loki does not index the contents of the logs. Instead it groups entries into streams, and indexes a set of labels for each log stream. You can use grafana or logcli to consume the logs. Loki supports clients such as Fluentd, Fluentbit, Logstash and Promtail.
- Promtail is a log collection agent built for Loki.
The roles of the components such as Prometheus, Loki, Grafana and Promtail are similar to the ELK stack. Grafana resembles Kibana. Promtail resembles Filebeat. Premethus exporters resemble Metricbeat. Both Premetheus and Loki resemble Elasticsearch in some aspects. Premetheus keeps metrics and Loki persists log streams.
These tools are heavily used in Kubernetes. For a simple start, I’d like to just configure two minimally working pipelines on my MacBook without any containerization. My example setup is to achieve the followings:
- Fake up some log lines and ship them to Loki
- Ship OS metrics to Prometheus
- Display the metrics and logs with Grafana
Here’s the diagram of what we want to implement:
This is simple enough to build a quick and dirty setup
Configure Node Exporter
We can use home brew to install node_exporter on MacOS. For Linux, use the equivalent package management tool:
brew install node_exporter
brew services start node_exporter
curl http://localhost:9100/metrics | grep "node_"
The node_exporter collect metrics and make it available for scrape using port 9100 as shown above.
Configure Prometheus
Install Prometheus with homebrew and start the service:
brew install prometheus
brew services start prometheus
If curl to port 9090 with GET returns “Found”, then Prometheus is successfully installed. We also want to configure it so it scrapes node exporter for metrics. Edit the configuration file, in my case, /usr/local/etc/prometheus.yml, by adding the followings:
  - job_name: node
    static_configs:
    - targets: ['localhost:9100']
This tells Prometheus to scrape metrics at specified interval. Restart Prometheus and browse to http://localhost:9090/ for Prometheus UI. Click on Status -> Targets and you can see the node as an export. Click on Graph and Execute a query for example “node_memory_free_bytes” and click on Graph. You should see a plot of the metric value.
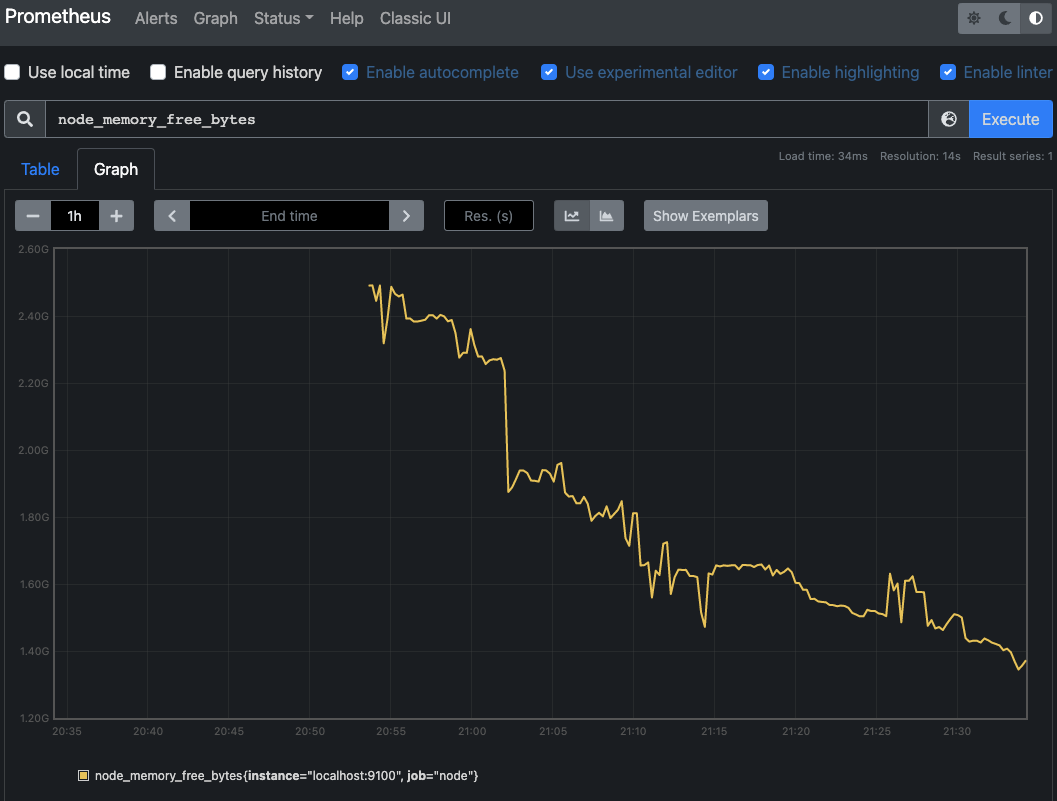
We can later configure to display the chart in Grafana.
Generate log lines
We use a tool called flog to generate fake logs:
brew tap mingrammer/flog
brew install flog
flog -f rfc3164 -l -d 300ms -t log -o /tmp/test.log -w
The command above produces log in RFC3164 format to /tmp/test.log, one line every 300ms. The log does not rotate.
Configure Loki
Install Loki with homebrew and start the service. We want to configure Loki before Promtail so it is ready to receive logs. You might as well install LogCLI to interact with Loki.
brew install loki
brew install logcli
brew services start loki
If nc to port 3100 returns success, then Loki is successfully installed.
Configure Promtail
Install promtail using homebrew:
brew install promtail
Note that Promtail is not installed as a homebrew service. Although it can be manually configured as a service, I’d rather stay focused and use command line just for the time being. A copy of configuration file is located in /usr/local/etc/promtail-local-config.yaml but it needs to be modified first with a job to tell it where to scrap the log lines. The configuration looks like this:
server:
  http_listen_port: 9080
  grpc_listen_port: 0

positions:
  filename: /tmp/positions.yaml

clients:
  - url: http://localhost:3100/loki/api/v1/push

scrape_configs:
- job_name: app
  static_configs:
  - targets:
      - localhost
    labels:
      job: applogs
      __path__: /tmp/test.log
Then, use the command as in the documentation to start promtail:
promtail -config.file /usr/local/etc/promtail-local-config.yaml
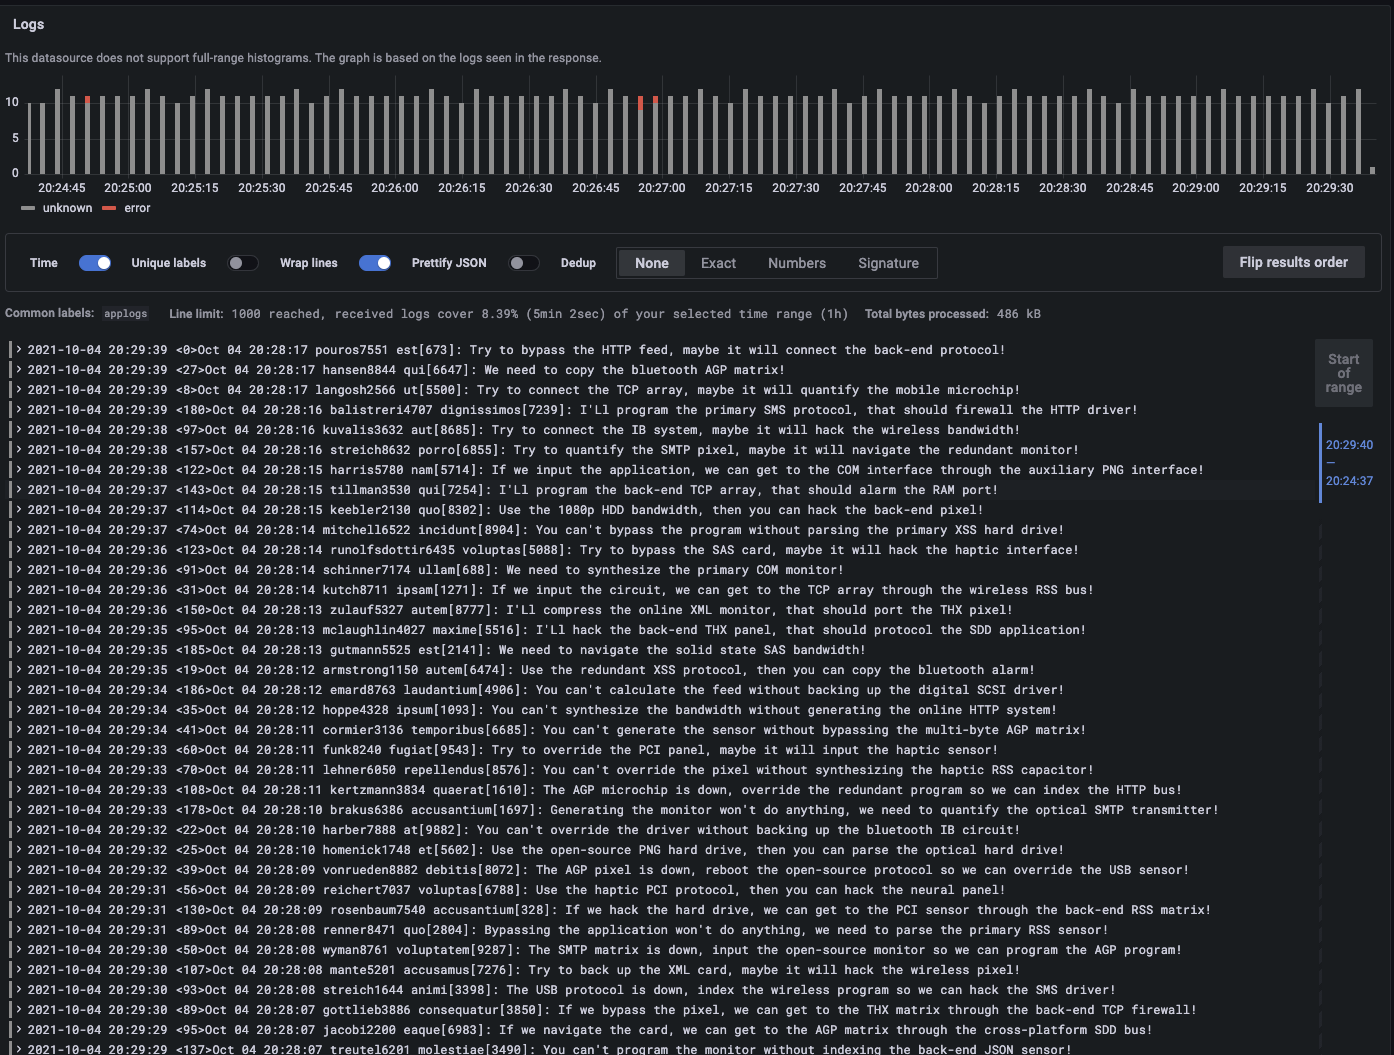
Port 9080 will be open when Promtail is running. Promtail will push logs to Loki. You can use LogCLI to interact with Loki and see the latest log lines pushed to Loki.
logcli labels job
logcli query '{job="applogs"}'
However, unlike Prometheus, Loki itself does not have any visualization capabilities. We will need Grafana to display the log nicely on the web.
Configure Grafana
We use Grafana to visualize both the logs and metrics. To install Grafana on Mac:
brew install grafana
brew services start grafana
If curl to port 3000 with GET returns “Found”, then Grafana is successfully installed. Browse to localhost:3000, with default credential admin and admin. From the UI, add two data sources. For the first data source, specify Prometheus as type and localhost:9000 as destination. For the second, specify Loki as the destination http://localhost:3100
The steps to see logs in Loki is pretty much the same as on this page of its documentation.
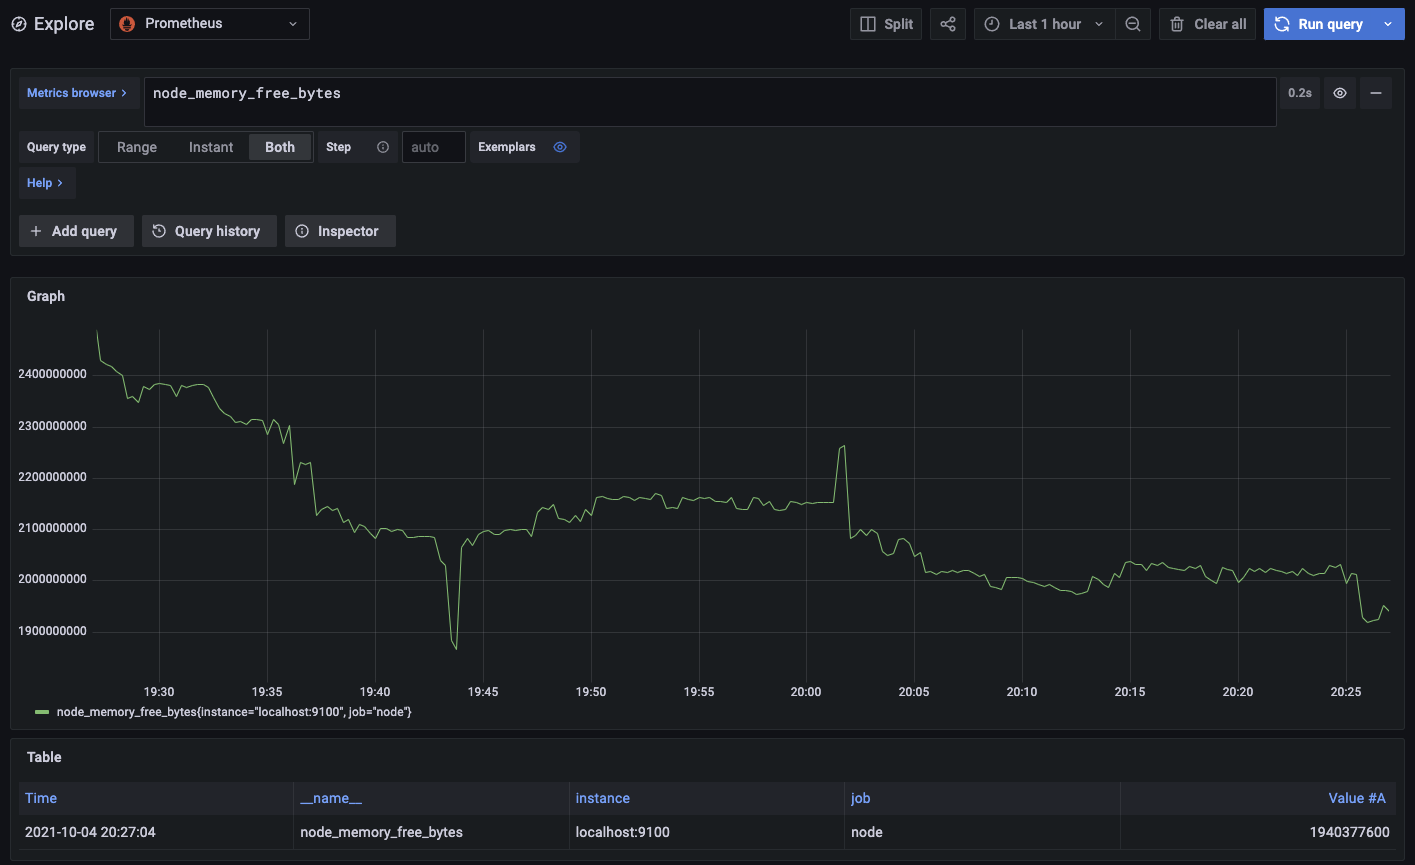
Exploring metrics data is similar. Click on Explore on the side bar, then select Prometheus from the dropdown as data source. Then execute a query such as “node_memory_free_bytes”.
With this quick and dirty configuration, we established a good understanding of what Prometheus, Loki and Grafana do. Next, we will move all these configurations to K8s cluster and understand some specific points of configurations.