
Introduction
The concept of autoscaling on Kubernetes platform dates from the era where virtualization first became widespread and the overhead of provisioning a new server became lightweight through the use of cloud-init. With public cloud, customers operate on usage-based billing. Autoscaling allows workload to scale down during idle times to reduce cost, and scale up during peak time to meet the demand of business traffic. Vertical autoscaling replaces a VM with one of higher capacity, which is usually interruptive. Horizontal autoscaling adds or removes VMs to adjust capacity, and works in conjunction with load balancing mechanism to assign load to a specific target in the group. Unless otherwise specified, we simply refer to horizontal autoscaling as autoscaling. Depending on what triggers autoscaling, it can be metrics based or event driven.
Metric-based autoscaling is based on VM (or Pod) metrics in the autoscaling group. The metrics are mostly about CPU usage, memory, IOPS, number of connections, etc. For example, when the average CPU utilization across all VMs in the last five minutes hits 70% threshold, then the scaler introduces a new VM into the autoscaling group. The trigger can factor in a variety of metrics. Advanced autoscaling APIs can also support lifecycle hooks, i.e. custom activities upon creation of new VMs during scale-up, or upon deletion of existing VMs during scale-down. Other aspects of custom behaviours include a cool-off period, i.e a no-activity window after the previous scaling activity. Since scaling activities are re-active.
Using real-time metrics as a trigger of scaling is not always a good idea. For example, a buggy order processing program may consume 100% of CPU due to an infinite loop, or 99% of memory due to memory leak. Metric-based scaling may fire off even though there is currently no order pending in the queue. Event-driven approach is more flexible. Event can fire from any type of source. For example, in Kubernetes, when scheduler fails to schedule a Pod due to constraints, it is an event This event can trigger scaling. In some case, a metric hitting a threshold fires an event. For example, scale up when size of order queue reaches 20. In this sense, metric-based autoscaling is a special case of event-driven autoscaling.
With Kubernetes, let’s examine node group autoscaling (aka cluster autoscaling) and workload autoscaling (Pod autoscaling).
Node Group Autoscaling
Cluster autoscaler is the mechanism to auto-scale node groups for Kubernetes. As per its documentation, any metric-based cluster/node group autoscalers are NOT compatible with CA. They are also not particularly suitable for Kubernetes in general. Take AKS for example, the events to trigger scale-up and scale-down are as below:
- The cluster autoscaler component can watch for pods in your cluster that can’t be scheduled because of resource constraints. The cluster then automatically increases the number of nodes.
- The cluster autoscaler decreases the number of nodes when there has been unused capacity for a period of time. Pods on a node to be removed by the cluster autoscaler are safely scheduled elsewhere in the cluster.
Both are in essence event driven. The behaviours can be fine-tuned with a number of parameters as below:
- scan-interval
- scale-down-delay-after-add
- scale-down-delay-after-delete
- scale-down-delay-after-failure
- scale-down-unneeded-time
- scale-down-unready-time
- scale-down-utilization-threshold
- max-graceful-termination-sec
- balance-similar-node-groups
- expander: random, most-pods, least-waste, priority
- skip-nodes-with-local-storage
- skip-nodes-with-system-pods
- max-empty-bulk-delete
- new-pod-scale-up-delay
- max-total-unready-percentage
- max-node-provision-time
- ok-total-unready-count
The parameters above constitute the autoscaler profiler, and are effective if cluster autoscaler is enabled. For many implementations, cluster autoscaler can be enabled and disabled even after the cluster has been created, and the parameters can be changed. The overhead of provisioning a new node should not be overlooked, because that is usually the window that a Pod needs to wait to get scheduled. As stated in CA’s FAQ, the main purpose of CA is to get pending pods a place to run, instead of pre-emptively accommodating to increasing workload.
The delay in pod scheduling while adding a new node can be controlled to a certain degree with one of the two workarounds below:
- With HPA or KEDA, set lower threshold so the workload level scaling acts more aggressive than the increase of demand. This buys some buffer time
- Use a tool to puff up utilization, such as cluster overprovisioner, which deploys pods that
- request enough resources to reserve virtually all resources for a node
- consume no actual resources
- use a priority class that causes them to be evicted as soon as any other Pod needs it.
In practice the cluster autoscaler setup should be conservative and keep node size as stable as it can. For example, a 20 minutes idle-window (low utilization) on a node is not worth the overhead to remove a node and add it back in 20 minute later.
When the cluster do need to scale down by removing a node, one common symptom is failing to scale down because some Pods have nowhere else to schedule to. Here is a list of possible causes as troubleshooting tips.
If node scaling should be triggered sparsely, then pod scaling is by design very dynamic. Cloud native applications should assume that pod scaling occurs very frequently.
In late 2021, AWS released the open-source project Karpenter for cluster autoscaler. Karpenter addresses some challenges with native Cluster Autoscaler on EKS. Karpenter is gaining momentum and now adding support for other cloud service providers including Azure.
Workload Autoscaling
Stateless workload are controlled by a Deployment object, which is associated with a replicaSet object. For stateless workload we can use HorizontalPodAutoscaler, or HPA. There is a VerticalPodAutoscaler (VPA) which is much less common. HPA is metrics based with flexible options such as specifying an object, depending on what metrics are available via metrics API. There are two versions of HorizontalPodAutoscaler: autoscaling/v1 and autoscaling/v2. The latter supports scaling policies, such as adjusting downscale stabilization window, and limiting scale down rate. No matter which API version, the metric-based triggers in HPA are fairly limited.
We already know that metrics are not always the best indicator to trigger scaling. We need an option to trigger scaling based on the status of other components such as queue size. KEDA (Kubernetes Event Driven Autoscaling) is a great option to consider for horizontal workload scaling. KEDA works with HPA, and significantly enriches trigger options. Apart from metrics, KEDA can use a number of external mechanisms as triggers, for example:
- RabbitMQ/Kafka/SQS: scale based on queue size
- Azure Log Analytics: scale based on a kusto query result against Azure Log Analytics
- AWS CloudWatch, Azure Monitor: scale based on metrics from Azure Monitor/AWS CloudWatch
- Azure Pipelines: scale based on agent pool queues of Azure Pipeline
- Elasticsearch: scale based on elasticsearch query result
- Kubernetes Workload: scale based on the count of running pods of a specified workload
- MSSQL, MySQL, Postgres, Cassandra: scale based on a query result
- Prometheus: scale based on prometheus query result
KEDA is a single-purpose and lightweight component. With KEDA, we don’t need to explicitly define HPA. It allows us to select from a longer list of triggering mechanisms for our auto scaler. We shall not underestimate the work needed to select the most suitable trigger because having an incorrect trigger (e.g. bad metrics) is costly. Let’s take Java applications as an example. Java workload operates in a JVM inside of the container. JVM request the entire heap size from operating system. The garbage collection activities also consumes a good portion of CPU cycles. This pattern makes CPU and memory metrics inaccurate as an indicator for scaling activity. Because of this we need to find out what is the best scaler for Java application, based on understanding of how the entire solution stack works as a whole.
The other aspect that KEDA beats HPA is its ability to scale to 0. This can be helpful when a service is idle most of the time but cannot shut down.
KEDA lab
let’s use Kafka as an example to configure KEDA for a dummy workload. We create a mock cluster using Kind with a simple configuration file. Then, let’s start with the following dummy workload with replica count set to 1:
apiVersion: v1
kind: Namespace
metadata:
  name: workload
---
apiVersion: apps/v1
kind: Deployment
metadata:
  name: aks-helloworld-one
  namespace: workload
spec:
  replicas: 1
  selector:
    matchLabels:
      app: aks-helloworld-one
  template:
    metadata:
      labels:
        app: aks-helloworld-one
    spec:
      containers:
      - name: aks-helloworld-one
        image: neilpeterson/aks-helloworld:v1
        ports:
        - containerPort: 80
        env:
        - name: TITLE
          value: "Welcome to Azure Kubernetes Service (AKS)"
---
apiVersion: v1
kind: Service
metadata:
  name: aks-helloworld-one
  namespace: workload
spec:
  type: LoadBalancer
  ports:
  - port: 80
  selector:
    app: aks-helloworld-one
We need to install KEDA and Kafka using Helm:
helm repo add kedacore https://kedacore.github.io/charts
helm install keda kedacore/keda -n keda --create-namespace
helm repo add bitnami https://charts.bitnami.com/bitnami
helm install kafka bitnami/kafka -n kafka --create-namespace --set volumePermissions.enabled=true --set replicaCount=3
Watch for all Pods to come up. Also read the notes from Kafa installation and confirm the Kafka service address. Now, we will apply KEDA scaled object, defined as below:
apiVersion: keda.sh/v1alpha1
kind: ScaledObject
metadata:
  name: kafka-scaledobject
  namespace: workload
spec:
  scaleTargetRef:
    apiVersion: apps/v1
    kind: Deployment
    name: aks-helloworld-one
  pollingInterval: 10
  cooldownPeriod: 30
  idleReplicaCount: 0
  minReplicaCount: 2
  maxReplicaCount: 5
  fallback:
    failureThreshold: 3
    replicas: 1
  advanced:
    restoreToOriginalReplicaCount: true
    horizontalPodAutoscalerConfig:
      behavior:
        scaleDown:
          stabilizationWindowSeconds: 300
          policies:
          - type: Percent
            value: 100
            periodSeconds: 15
  triggers:
  - type: kafka
    metadata:
      bootstrapServers: kafka-0.kafka-headless.kafka.svc.cluster.local:9092
      consumerGroup: my-group       # Make sure that this consumer group name is the same one as the one that is consuming topics
      topic: test
      # Optional
      lagThreshold: "5"
      offsetResetPolicy: latest
The field definitions are on KEDA deploy documentation. Items under Kafka trigger are on the trigger documentation. In this lab we set the idelReplicaCount to 0. It will scale up with average lag of all partitions reaching 5. In the next few steps, we’ll mock up some messages posted to the Kafka topic named “test” for consumer group my-group. We can watch deployment size grow along with the growth of lags.
To emulate Kafka client activity, we can spin up a Kafka test Pod:
kubectl run kafka-client --restart='Never' --image docker.io/bitnami/kafka:2.8.1-debian-10-r73 --namespace kafka --command -- sleep infinity
kubectl exec --tty -i kafka-client --namespace kafka -- bash
From within the Pod, we can leverage the client-side scripts located in /opt/bitnami/kafka/bin/. For example, to post message to a topic (e.g. named test):
kafka-console-producer.sh --topic test --broker-list kafka-0.kafka-headless.kafka.svc.cluster.local:9092,kafka-1.kafka-headless.kafka.svc.cluster.local:9092,kafka-2.kafka-headless.kafka.svc.cluster.local:9092
The Helm installer also gives the command with broker list. To consume messages from a topic (e.g. test) to a given consumer group:
kafka-console-consumer.sh --topic test --bootstrap-server kafka.kafka.svc.cluster.local:9092 --group my-group
We can have two command terminals, post test messages on one terminal and watch it consumed nearly immediately on the other terminal.
The Kafka trigger documentation suggests that the number of replicas will not exceed the number of partitions on a topic when a topic is specified. To make this lab work, we need to have set 5 partitions:
kafka-topics.sh --alter --bootstrap-server kafka.kafka.svc.cluster.local:9092 --topic test --partitions 5
kafka-topics.sh --describe --bootstrap-server kafka.kafka.svc.cluster.local:9092 --topic test
Once we confirm five partitions, we can spin up two command terminals, one to produce message and the other to consume messages. If working, we can stop the consumer and use the command below to watch for the lag for each partition.
kafka-consumer-groups.sh --bootstrap-server kafka.kafka.svc.cluster.local:9092 --describe --group my-group
Now we can artificially trigger scaling by increasing average lag. We keep posting messages on the producer (each carriage return posts a message), and we can check the lag after posting:
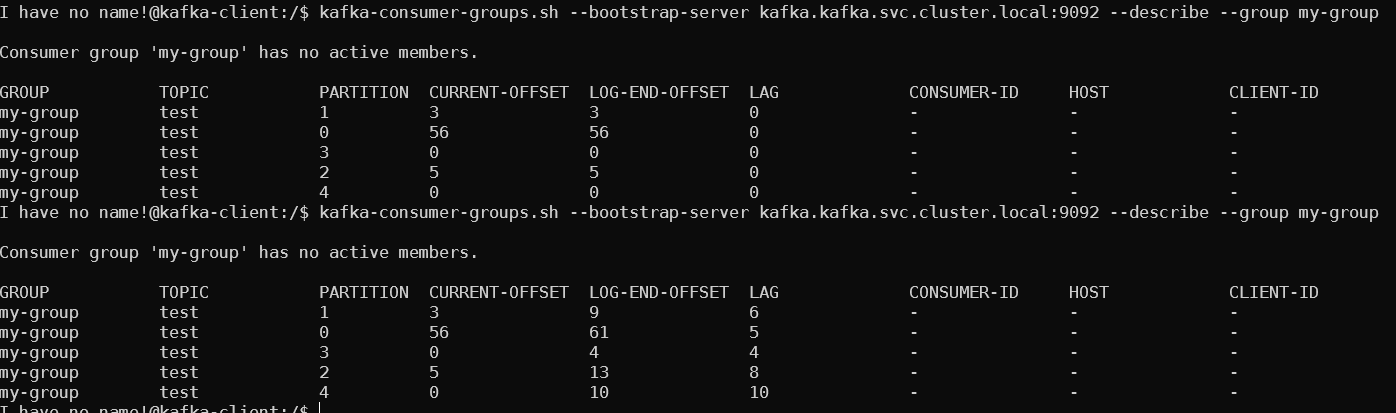
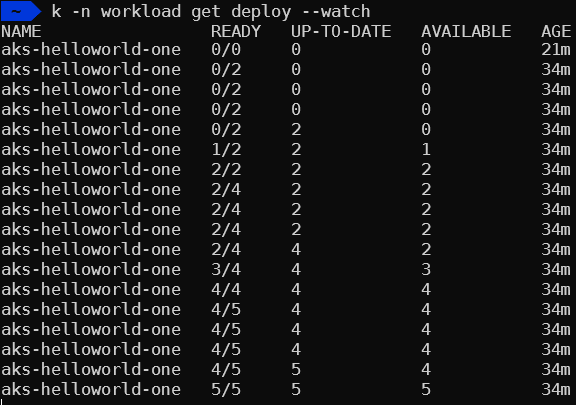
The size of deployment starts with 0 as defined in the scaled object. As the average exceeds 5, we can see deployment size growing.
This lab is an oversimplified scenario to illustrate the idea of scaling. Kafka is a typical queue construct and other queue configuration such as RabbitMQ or AWS SQS works in very similar ways. Real life use case involves more aspects to consider, such as multiple topics, and authentication.
Connection triggered wake-up
KEDA uses Events to scale workload from zero to one (wake up). There is no way to scale (wake up) based on an incoming web request. In many cases, such as serverless configuration, we need to scale the deployment size from zero to N once the service receives incoming web request. This is not supported by KEDA. By definition KEDA uses Events to wake up.
There is an HTTP-add-on for KEDA still at beta but it is trying to address this problem. This page shows the design. Suppose a service has scaled down to zero, the followings will happen to wake it up:
- The incoming request is routed to an interceptor behind the service
- interceptor keeps track of number of pending HTTP request
- The scaler periodically watches for the size of the pending queue on the interceptor
- Based on the queue size, the scaler reports scaling metrics as appropriate to KEDA
- As the queue size increases, the scaler instructs KEDA to scale up as appropriate
The periodical check activity is the key to make it work and also what makes it a pseudo-trigger.
Summary
Fine-tuning autoscaling is important to the performance of workload on Kubernetes. At node level, we briefed on cluster autoscaler and suggest that we only use it sparsely. At pod level, we introduced native HPA as well as KEDA, with an example. We also discussed KEDA has limitations and the HTTP-add-on. In the next post, we’ll explore Knative’s autoscaling capability.